Signature Visualization
The Signature Visualization App offers a dynamic platform for exploring gene expression patterns through interactive visualization. Integrating over 9000 gene signatures from five distinct collections, including four from CREEDS database and one from Connectivity map (CMAP), this tool allows users to compare specific signatures against a curated list of genes known as top table genes Top tables app. Upon selecting a signature, users are presented with a comprehensive metadata table detailing the signature’s origin, facilitating a deeper understanding of the genetic underpinnings of various biological states and responses.
Upon launching the app, users can precisely adjust their search parameters using the Collection, Signature, and Comparison filter bars.
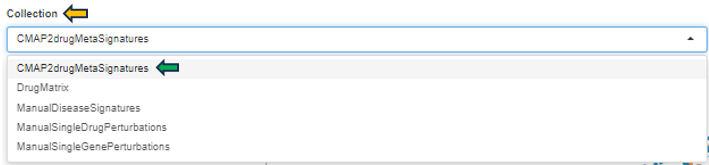
Collection
This filter specifically enables users to narrow down their exploration to gene expression datasets pertinent to different biological states and experiments:
-
CMAP2drugMetaSignatures: Focuses on gene signatures from metabolic responses to drug treatments.
-
DrugMatrix: Encompasses signatures from drug effect studies across various cell types or tissues.
-
ManualDiseaseSignatures: Features curated gene signatures linked to specific diseases, facilitating the discovery of disease-associated genetic markers.
-
ManualSingleDrugPerturbations: Contains signatures from studies examining the effects of single drugs.
-
ManualSingleGenePerturbations: Offers signatures from research on the effects of perturbing individual genes.
Signature
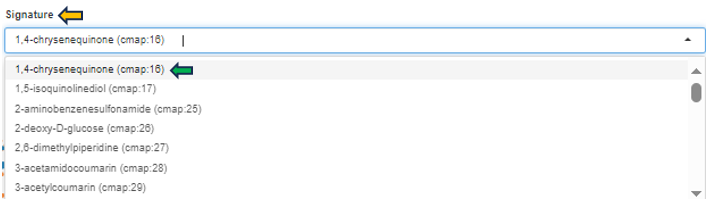
This feature enables researchers to explore how different compounds affect gene expression, aiding in the identification of potential therapeutic targets or the understanding of compound mechanisms. This filter allows users to select specific gene expression profiles or signatures associated with various compounds or treatments. Each option represents a unique gene expression pattern resulting from exposure to a particular substance. The numbers (e.g., cmap: 16) are identifiers within the “Connectivity Map (CMAP)” database, facilitating easy reference to detailed experimental results.
Comparison

This option guides users to a selector tool, facilitating the selection of specific comparisons for thorough analysis (for detailed guidance on utilizing the Comparison Selector feature, please refer to the manual available here Comparison selector). Engaging with this feature allows users to explore the intricate relationship between their chosen comparison and the gene signature in question.
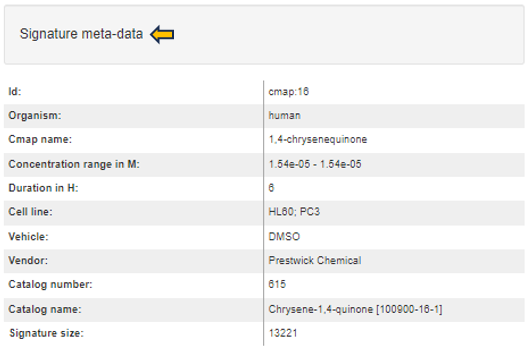
Signature meta-data
The signature metadata table on the left side presents detailed metadata associated with the selected signature collection and ID. This table aggregates and displays comprehensive information that characterizes the signature’s origin, facilitating a deeper understanding of its background and relevance within the chosen collection.
Signature plot
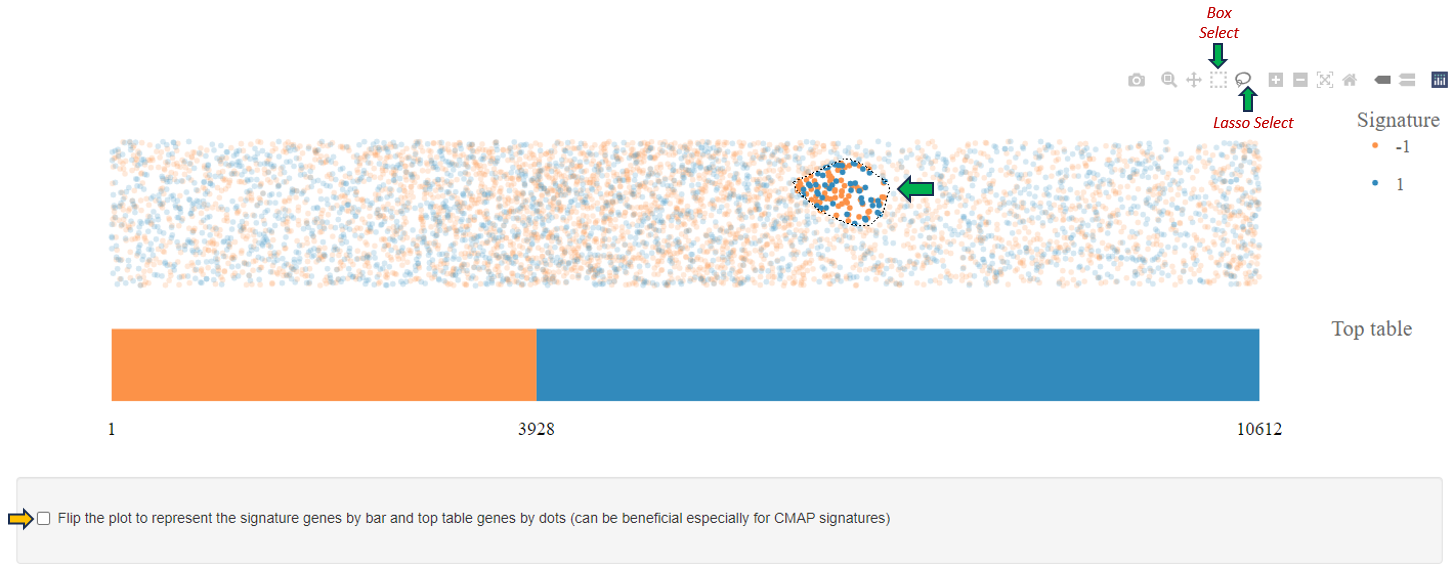
After selecting a top table dataset as well, the signature plot is visualized in the central part of the app.
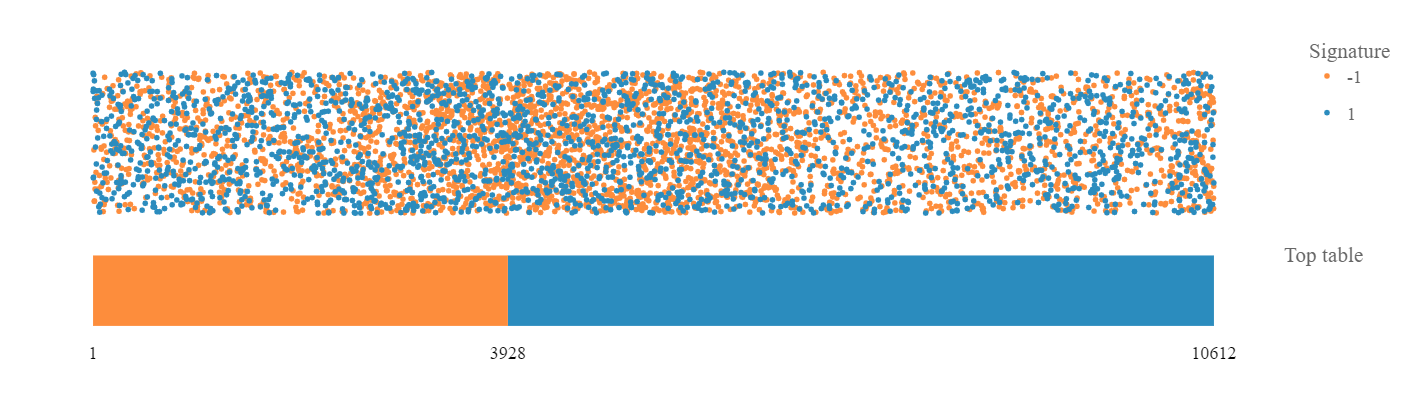
The bar represents top table genes:
- In orange are down-regulated gene and in blue are up-regulated genes, ordered according to the fold-change. The numbers of down-regulated genes and all top table genes are marked at the bottom of the bar. The dots above the bar represent signature genes mapped to the ordered top table genes and the color reflects regulation of genes in the signature.
- The resulting plot is interactive: hover dots to see data labels, click-drag to zoom, double-click to autoscale.
- Further, you can click the “Flip the plot” checkbox and the visualization of top table and signature will be reversed: the signature will be represented by the bar and the top table genes will be represented by the dots. Especially, CMAP signatures can benefit from the flipped visualization.
- If you change the hover mode to ‘Box Select’ or ‘Lasso Select’, a table of selected data points (dots) is visualized bellow the plot. If you wish to visualize only up-regulated/down-regulated signature genes, click on the legend dot representing down-regulated/up-regulated genes and these will be hidden in the plot.
Signature genes selection table
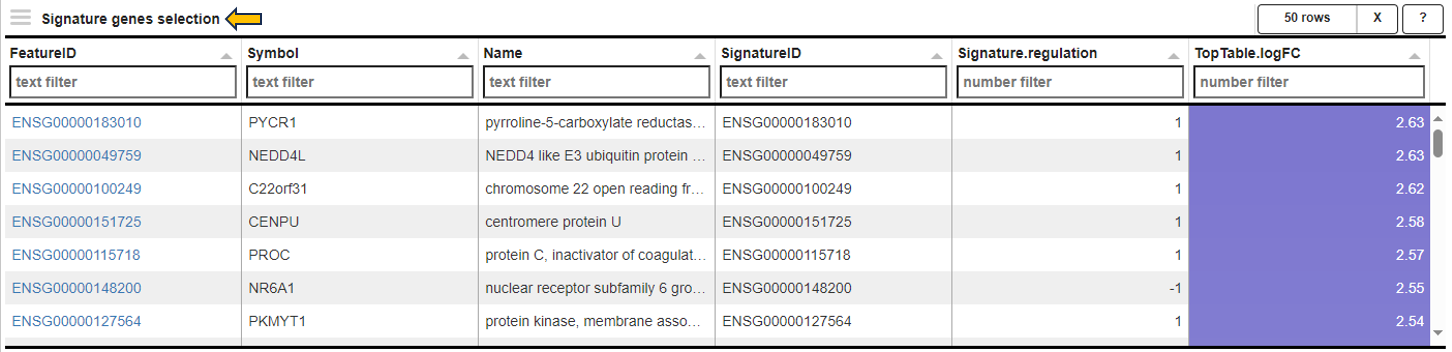
If the signature statistics were pre-calculated when generating a new top table (see the comparisons app), these statistics are visualized in the table at the bottom left side. The type of statistics included in this table differs based on the type of the selected signature (e.g. based on length of the signature and values representing the signature).
Signature statistics
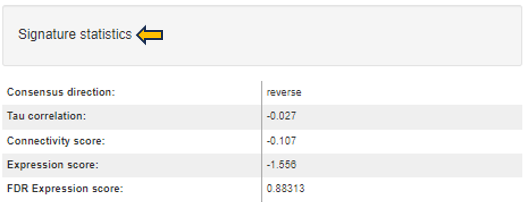
For signatures from CMAP collection the following statistics are provided:
-
Consensus direction: Telling whether the signature gene regulation is mimicking or reversing the top table regulation (according to the most of the statistics; if statistics are inconclusive the direction is ’none’).
-
Tau correlation: Kendell’s tau correlation coefficient (based on signature effect size values correlated with full profile of top table fold-changes; ranges between -1 and 1).
-
Connectivity score: A nonparametric, rank-based pattern-matching score based on the Kolmogorov-Smirnov statistic (as defined by Lamb et al. 2006, however not scaled to range of -1 and 1). Top table genes are compared to rank-ordered signature gene list to determine whether up-regulated top table genes tend to appear near the top of the signature list and down-regulated top table genes near the bottom (“positive connectivity”) or vice versa (“negative connectivity”).
-
Expression score: A score based on signature z-scores multiplied by up/down information of significant top table genes. Normalized to the top table size and transformed to z-scores.
-
FDR Expression score: Corresponding false-discovery rate value assessing the significance of z-scores.
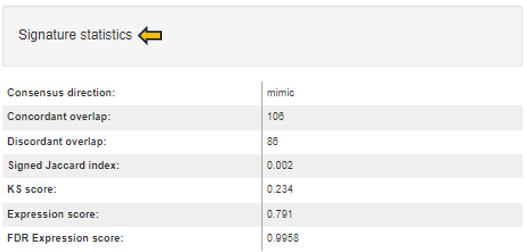
For signatures from CREEDS collection the following statistics are provided:
-
Consensus direction: Similar as above (mimic, reverse, or none).
-
Concordant overlap: A number of genes that are common for both the signature and top table gene lists, and have the same regulation sign in the both lists.
-
Discordant overlap: A number of genes that are common for both the signature and top table gene lists, but have different regulation sign in the both lists.
-
Signed Jaccard index: Signed version of Jaccard similarity coefficient as defined by Wang et al. 2016 (ranges between -1 and 1).
-
KS score: Kolmogorov-Smirnov statistic-based score similar to Connectivity score. In contrast to the connectivity score, the signature genes are compared to rank-ordered top table gene list.
-
Expression score: A score based on negative logarithm of FDRs from top table genes multiplied with fold-change direction and signature direction. Normalized to the signature size and transformed to z-scores.
-
FDR Expression score: Corresponding false-discovery rate value assessing the significance of z-scores.