Project Overview
Projects in transcriptomics can hold multiple studies, aggregating data from different experiments. This allows to compare data generated on different technology platforms, different protocols and different biological systems. The Project Overview app provides an overview of the data sets with the current project.
Dashboard panel

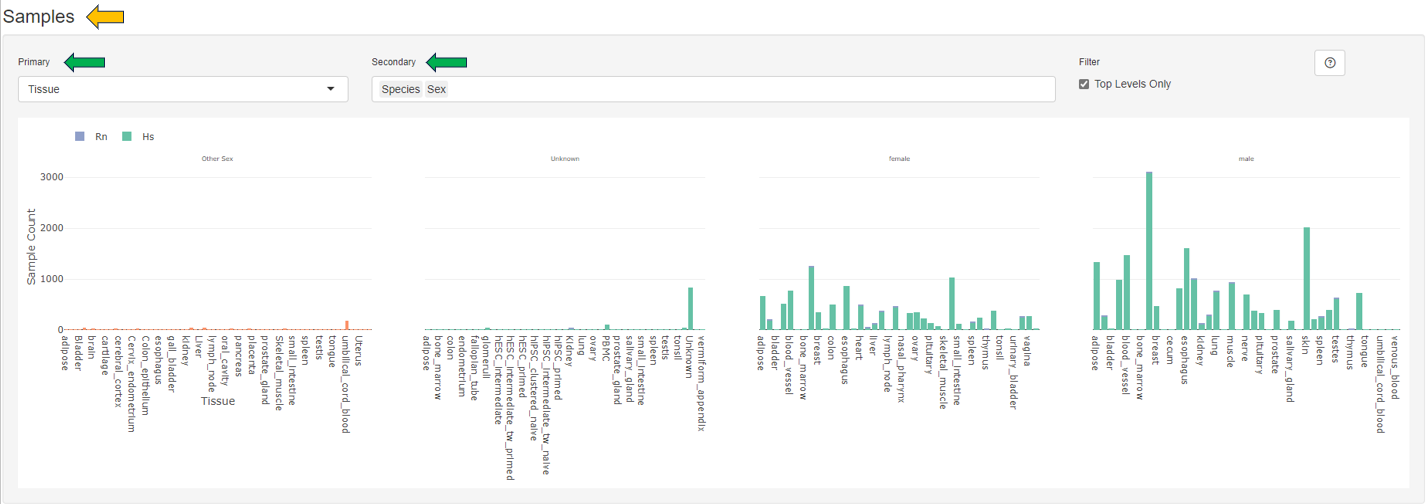
The first panel on the left shows an interactive bar graph of the number of samples in the project. Sample numbers can be aggregated by “Study”, “Species”, “Platform”, “Protocol”, or by the sample categories defined in the project.

Details panel

Here, you find more detailed information about the different types of samples within each study. Studies with an info icon next to its name have additional study information available. To see them, click on the respective info icon.

Insights panel

Transcriptomics allows for a highly interactive exploration of complex datasets. The Insights panel allows researchers to share the results of their work with other team members. Documents of different formats (common office docments, pdf, or txt) can be uploaded.

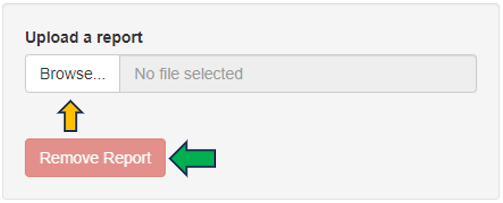
On upload, each document is assigned to a specific study. Uploaded documents are presented to all users as an interative table, detailing the upload date, study, user, and name of the document. Documents can be download by clicking on the link in the “Name” column. Documents can be removed by selecting the corresponding row and clicking the “Remove Report” button.
