Network Visualization
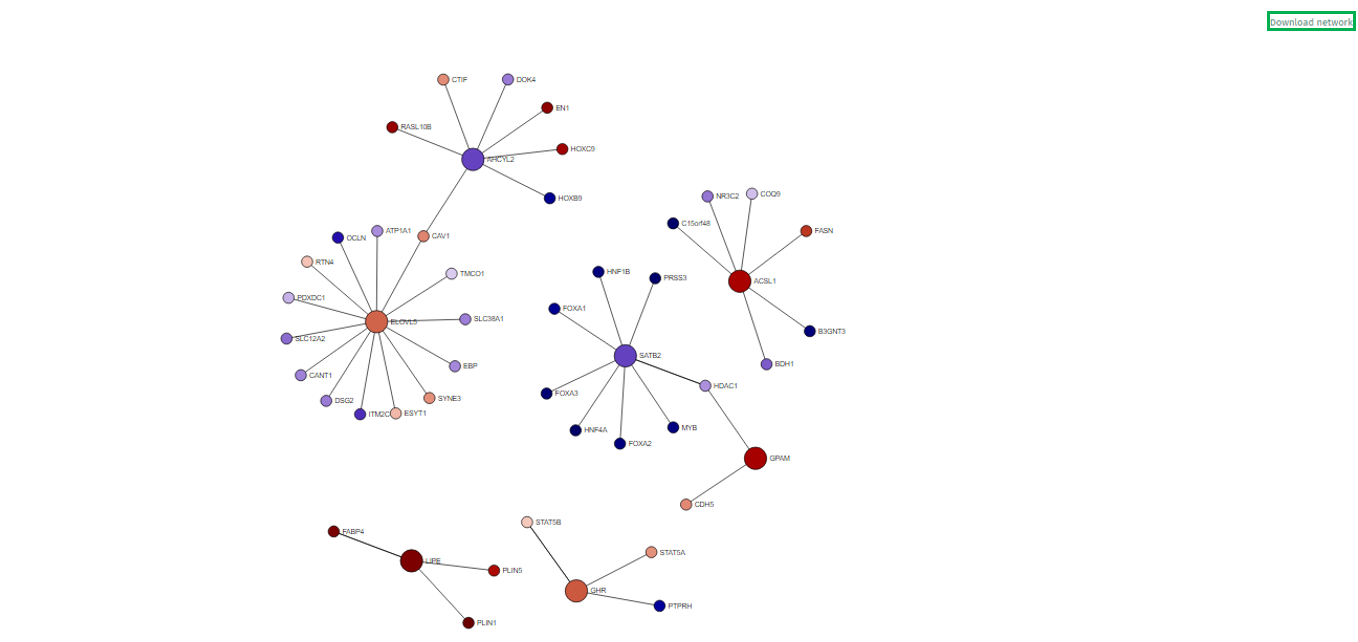
The network visualization app provides an interactive visualization of top table genes in the context of gene and protein interaction networks. For this purpose, the BioGRID database is used.
Comparison selector
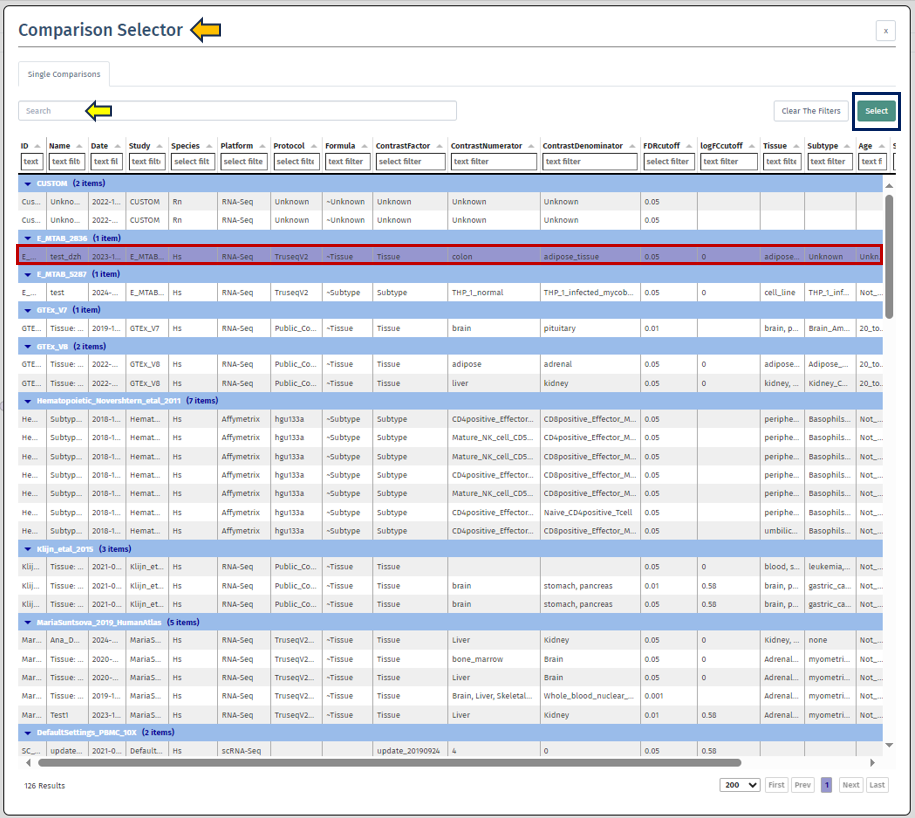
To initiate the analysis, the user is required to first select a specific comparison or dataset. This is done with the help of the “Comparison” box located prominently at the top of the app. Upon clicking this search box, the “Comparison Selector” window will open. Here, users are presented with a range of available comparisons to choose from. By navigating through this panel, they can select the desired comparison for their analysis.

To accurately focus on the most relevant comparison for analysis, users can utilize various elements in the comparison table such as:
-
the elements related to the study; ID (categorized by studies), Study, Platform,Protocol
-
the elements related to the samples; Species, Name, Tissue, Subtype, Age, Sex, Ethnicity, Cell type
-
technical elements; scCluster, Technical batch, FDR Cut-off, LogFC cut-off, Formula, Contrast Factor, Contrast Numerator, Contrast Denominator, Formula Terms, Name, Tissue, Subtype
Once the desired dataset has been obtained by applying the appropriate filters, the user is required to select the dataset by clicking on it, followed by clicking on the “Select” button located at the top right corner of the “Comparison Selector” panel.
Users can also simply type the name of the desired dataset into the “Search” bar located above the table. The search feature will then narrow down the displayed results, enhancing efficiency in finding the desired dataset.
To generate a comprehensive network, users must specify additional details. This can be accomplished through “Network Selection” and “Feature Selection” panels on the app’s left side. Collectively, these panels contribute to the customization and refinement of the network generation process.
Network Selection
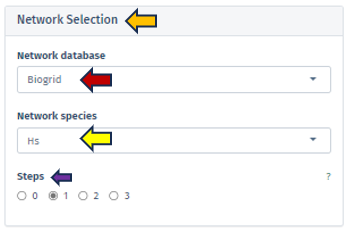
Network Database
This feature allows users to select the specific database from which they wish to extract their network data. Currently, the selection is exclusively limited to the BioGRID database, a comprehensive resource for biological interaction data.
Network Species
Users must specify the species whose network will serve as the reference point. It is important to note that the human reference network generally offers more detail compared to other species. Therefore, in scenarios where the top table data pertains to a species other than humans, the genes are mapped to their human orthologs, where feasible. Users should be aware that orthologous genes may have different symbols across different species.
Steps
Through this parameter, users have the ability to adjust the size of the displayed network. This parameter is crucial for controlling the expansion of the network from the selected genes of interest, with the number of steps corresponding to the amount of nodes added to the subnetwork. Setting the steps to ‘0’ focuses the network exclusively on interactions between the selected genes, omitting additional nodes and thus providing a concise view of direct interactions, ideal for examining precalculated subnetworks or specific gene interactions. It is advisable to commence with a lower number of steps to manage the network’s size and complexity.
Feature selection
The Feature Selection panel empowers users to make specific choices about the genes or features they wish to include or emphasize in their network analysis. This selection process is integral as it precisely defines the scope and focus of the network visualization, thereby guiding the direction of the analysis.
Feature Selection Type
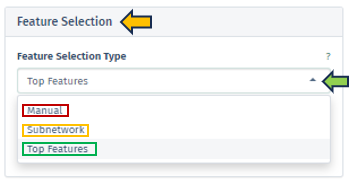
In this panel, users have the option to specify their preferred feature type from a dropdown menu. The selection criteria for genes of interest can vary, encompassing options such as a single target gene, genes within a regulated subnetwork, or the first N top genes as identified in the selected top table.
-
Manual: Users can manually input target genes to search for corresponding interactions within the network. It is important to note that orthologous genes might have varying symbols across different species, a factor that users should consider during manual entry.
-
Subnetwork: This option allows users to choose from pre-extracted subnetworks, which are part of the top table’s post-processing. Regulated subnetworks are determined using the algorithm proposed by Breitling et al. 2004 during the creation of a new top table in the New Comparison app. These subnetworks are then named based on the central seed gene and the number of genes they cover. These subnetworks are identified by the symbol of the central gene and the count of encompassed genes, providing a focused view of specific gene interactions.
-
Top Features: In cases where no specific target genes or subnetworks are identified, the application defaults to using the most significant genes, referred to as top features.
-
The “Number of top features” setting enables users to define the extent of top features they wish to include in their analysis, allowing for a customizable approach in exploring the most impactful genes.
Upon selecting the desired species and identifying specific genes of interest, this application generates and visualizes a comprehensive network that encapsulates and interconnects these genes. This visualization is informative and interactive, enhancing the user’s analytical experience.
Additional Parameters
This app provides users with a more nuanced and customizable experience in network analysis through the “Additional Parameters” panel. This panel offers a suite of options for refining and enhancing the network visualization, each tailored to specific aspects of the network:
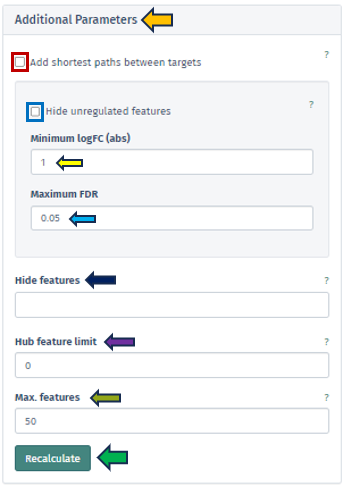
Add Shortest Paths Between Targets
This feature, when activated, includes all genes that lie on the shortest paths between the target or top genes within the network. It ensures a comprehensive view of the gene interactions and pathways. This option is not applicable if a subnetwork has been pre-selected.
Hide Unregulated Features
Provides users with an option to hide unregulated genes in the visualization. When this option is activated, only nodes corresponding to genes that meet specific criteria are displayed. Specifically, those with an absolute log fold change more significant than the specified minimum logFC value and a false discovery rate below the maximum FDR threshold. However, it is essential to note that unregulated genes bridging the gap between genes of interest and regulated genes will still be shown to maintain the integrity of the network’s structure.
Hide Features
Allows users to address the challenge of graph clutter caused by genes that interact with an excessively high number of other genes. Users can input a list of gene symbols (separated by spaces or commas) to exclude these high-interaction genes, thereby simplifying the network for clearer analysis.
Hub Feature Limit
To avoid overwhelming the network with hub features that have numerous interactions, this setting enables users to set a limit on the number of interactions a hub feature can have. Unregulated hub features that are not part of the Feature Selection can be removed if they exceed this limit. Setting this to 0 implies that no hub features will be removed.
Max Features
This feature allows users to set a limit on the number of genes visualized in the network. The application will prioritize the removal of features based on their distance to the target/top features, as well as their FDR and logFC values. Features that are more distant, less significant, and less strongly regulated will be removed first.
Each of these options in the Additional Parameters panel is designed to give users greater control over their network visualization, enabling them to tailor the network to their specific research questions and preferences.
Upon configuring the various criteria in this panel, which can be done through manual input, selection from a dropdown menu, or by utilizing the spinner control buttons, users can initiate the application of these changes by pressing the “Recalculate” button. This action prompts the application to integrate the newly set parameters into the displayed network. The implementation is designed to be efficient and precise, ensuring that the network visualization is promptly updated to reflect the adjusted settings. In instances where genes cannot be mapped to the reference network or become disconnected from other genes after applying these filters, they will not be included in the display. This ensures that the visualization remains relevant and focuses on the most pertinent gene interactions.
Network Representation
-
In the visualized network in the app’s main tab, each gene is depicted as a circle, known as a node. To emphasize the genes of primary interest, comparatively larger circles represent these.
-
The color filling of each node corresponds to the log fold change value associated with that gene, with blue indicating up-regulation and red signifying down-regulation. This color coding provides an immediate visual cue regarding the expression status of each gene.
Interactivity and Navigation
-
Users can interact with the network by rearranging the nodes. This is achieved by pressing the left mouse button on a node and dragging it to a preferred location. The network’s structure will automatically adapt to these changes.
-
A single left-click on any node will highlight it and all its directly connected nodes, making it easier to focus on specific gene interactions. A second click reverts the view to the entire network.
-
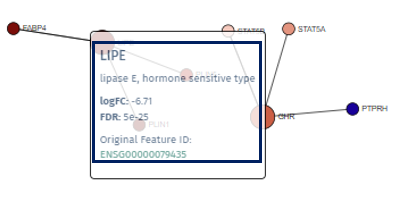
Right-clicking on a node reveals a popup field that offers additional information about the gene, such as a direct link to the Gene Info app, enriching the user’s understanding with detailed gene data. A second right-click will close this popup.
- The network can be zoomed in and out using the mouse wheel, enabling users to adjust their view for a more detailed or broader perspective.
Users can download their customized network directly from our application using the “Download Network” button at the network display’s top right corner. Upon clicking this button, the application generates a web-based file encompassing the network in an interactive format. This functionality allows users to save their work for future reference and engage with the network offline in a dynamic and user-interactive manner.
