Comparisons
Comparisons app is used to inspect and compare tables of differentially expressed features (Comparisons) available in PanHunter. Most of the comparisons in PanHunter are generated in the New Comparisons app, potentially in the scExplorer, and even calculated outside of PanHunter, in which case they are refered to as Custom Comparisons in PanHunter.
In addition to single comparisons mentioned above, the Comparisons app supports exploration of Comparison Groups. To learn more on the concept of Comparison Groups, and how they differ from single Comparison, refer to XXX.
<The panels provide information about all or most recently generated Comparisons (see the respective radio buttons on the top-left hand side).
 >
>
The app comprises panels for overview, comparison of multiple comparisons and inspection of comparison groups.
<Additionally, selected Comparisons (selected rows in the overview table in the first panel) can be updated by clicking the “Update” button on the left hand side. This is useful, for example, when new samples are available and the Comparison should be recalculated.>
Comparisons overview
The first available panel in the app is Comparisons OVerview panel.
The overview panel contains Comparison overview table which lists comparisons calulcated in PanHunter, grouped by original Study. The table is accompanied by action items on the left-hand side.
**Comparisons Overview table**
Each row in the Comparison Overview table represents one specific comparison, and the first column for each comparison indicates the name of the Study that comparison was calculated in. Second column gives the Name of the comparison defined by user during calculation, and is followed by unique comparison ID right next to it.
The table provides additional information about each comparison, such as the date of calculation, information about method, formula and cuttoffs used for calculation, details on contrast factor, numerator and denumerator, the number of samples used in the Comparison and the number of present, up, and down regulated genes, as well as details about omics dataset itself.
In addition to standard table functionalities in PanHunter, click on the individual row belonging to specific comparison will select that comparison.
Once individual comparison is selected, Administration, Data and Go To panels left to the table become available. <add reference to image if needed here, maybe the first image on top before focus on the table?>
**Administration**
The Administration panels provides user option to:
- Update - This will trigger comparison recalculation. This is useful, for example, when new samples are available.
- Compare Sample Table - Allows user to compare sample table used during comparison computation and presently and the sample table recreated based on the Comparison recipe. Only categories involved in formula for Comparison computation are taken into consideration. Comparison result is shown as a message at the top of the app. Main reason of difference between stored and recreated sample tables are updates of sample tables (addition of new samples or changing sample annotations). If differences between stored and recreated sample tables are identified, please consider updating the Comparison.
- Check Comparison - Initiates the check whether the Comparison saved and a comparison recomputed based on the Comparison recipe and previously saved sample table are different (i.e. recreation of sample table is not performed as a part of this comparison). A standard reason of difference between stored and recomputed Comparisons are updates in methods for Comparison computation. If differences between stored and recomputed Comparisons are identified and these differences were not expected, please cosult with PanHunter team, or assigned bioinformaticians. All updates in metods affecting calculations are available in our Changelog
. - Remove - Deletes comparison from the project. Please keep in mind that once deleted, comparisons can’t be retrieved. Use with caution.
- Download - Downloads all files associated with selected comparison. The files are packed as zip archive. Please refer to
at the bottom of this page for more information.
Please keep in mind that once triggered, Update and Remove functions can’t be reversed.
In case comparison has been calculated by scExplorer or outside of PanHunter,
**Data**
The Data tab provides user with options for downstream exploration of comparison results and associated post-processing steps performed during computation.
- Comparison - Opens the results of differential abundance analyses (fold changem p-value, FDR) for the features found significantly regulated.
- Geneset Enrichment - Opens results of gene ontology term enrichment analysis.
- Pathway Enrichment - Shows overview of pathways of which the differentially abundant features are members. Calculated based on the gage and GeneAnswers R-packages.
- Signatures - Shows additional information on which known compounds leads to similar differentially abundant features.
- Transcription Factors - Show downstream analysis of the transcription factors that might be relevant to the changes in feature abundances observed in this Comparison.
- Networks - Show the gene interaction networks enriched with differentially regulated features.
Please note that available options depend on post-processing steps selected for each comparison, further explained here
**Go To**
This section provides quick lins to other PanHunter apps where selected comparison can be further explored. Please note that selection of available apps may vary, depending on data available for the comparison.
Compare Comparisons

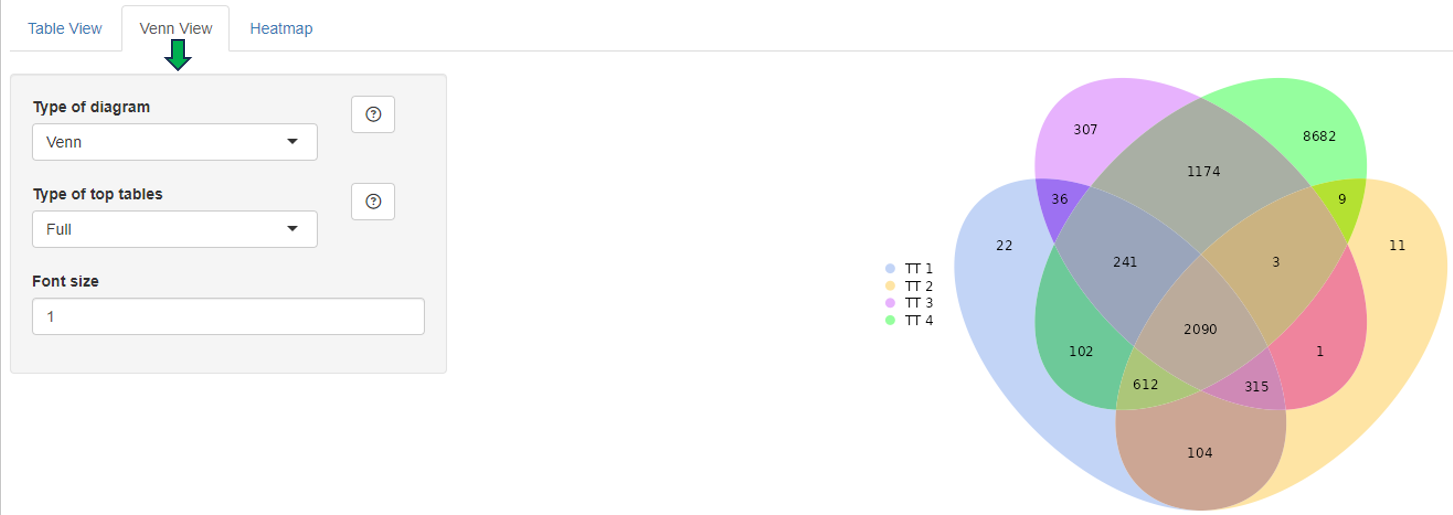
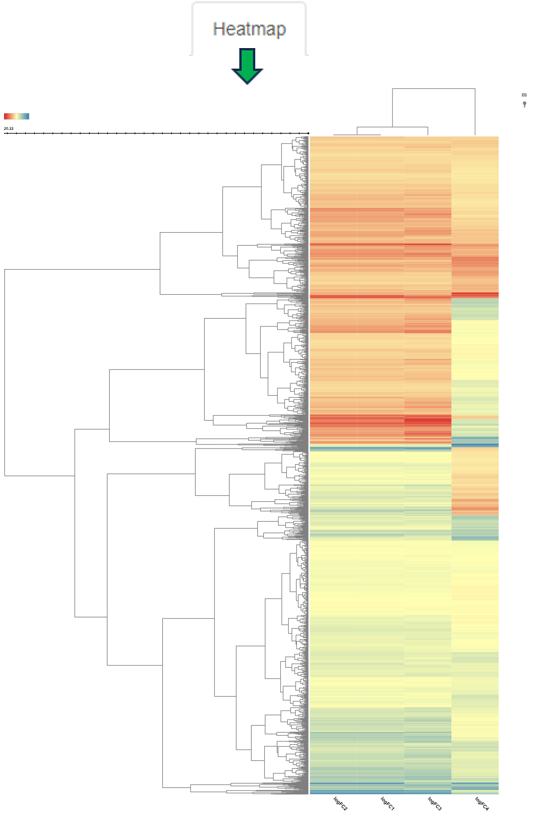
This panel is used to compare the genes present in different Comparisons. Up to four Comparisons (Top table 1 - Top table 4) can be selected.

After selection, a merged meta-table containing the expression levels (CPM), log fold changes (logFC), and log false discovery rates (log10FDR) for all detected genes in all selected Comparisons is displayed below the user interface. The column titles indicate the respective Comparison, e.g. “CPM1”, “logFC1”, “log10FDR1”, “CPM2”, “logFC2”, and “log10FDR2” in case of two selected tables.
For more information about the matching of features between proteomics or peptidomics Comparisons, please see the Algorithms section.


The columns can be sorted and the fold changes are color-coded (violet color for up and red for down-regulation). Each gene (row in the table) is characterized by its Ensembl and gene ID, symbol, and common name.
Before merging, the selected Comparisons may be filtered according to an expression level (CPM1-4) or log fold change threshold (logFC1-4) (see text fields on the right hand side of the selection menus). For example, the expressions “> 1” (CPM1 field) and “> 2” (logFC1 field) would filter the first selected Comparison for genes associated with an expression level greater than 1 and a log fold change greater than 2 before merging it with the other selected tables. Thresholds may be specified for all selected tables. The changes are applied to the meta-table after clicking the “Filter” button below the text fields. Additionally, the output table can be filtered for genes associated with particular GO terms or gene symbols.
The symbol filter is based on regular expressions:
- Normal text matches (case insensitively) anywhere in the gene symbol
^anchors the search to the begin of the symbol$anchors the search to the end of the symbol[]matches any of the characters within the brackets|represents alternatives, e.g._PER|TIMELESS_may find PER1, PER2, and TIMELESS.is a wildcard matching any character+means that the preceding character can be repeated one or more times.
Example: ^Pko[1234567890]+$ matches any symbol starting with “Pko” followed by one or more digits. A Pko binding protein, e.g. Pko2bp, will not be found since the dollar sign marks the end of the string.
In a multi species Comparison, the symbol filter works on the first selected table.
In addition to the described filter options, the number of rows of the generated output table can be limited by means of the “Max rows” input field. In this case, only the top genes sorted according to false discovery rate (starting with the first selected table) are displayed. This option is useful when dealing with very large tables.
The output table can also be downloaded as Excel file (see the “Download XLSX” button below the input fields).
Comparison Groups

Download Comparison Data
To download all data pertaining to a Comparison:
- Select the “Comparisons Overview” tab.
- Select a Comparison from the table by clicking on it.
- In the “Administration” box on the left, click on button “Download”.
A ZIP-file will be downloaded to your device. The next section describes the contet of this file.
Files and folders - Overview
This is a list of files and folders found in the downloaded ZIP-file. Please note that the top-level files are always present. Folders and files in folders vary depending on the post-processing steps that were performed when creating the Comparison.
- 📄 DifferentialFeatureAbundance.csv
- 📄 Metadata.json
- 📄 Recipe.json
- 📄 SampleTable.csv
- 📂 Enrichments
- 📄 GOBP.csv
- 📄 GOCC.csv
- 📄 GOMF.csv
- 📄 Wikipathways_Rn.csv
- 📂 FilteredOut
- 📄 ModelBased.csv
- 📂 Networks
- 📂 Biogrid
- 📄 Hs.csv
- 📄 Rn.csv
- 📂 Biogrid
- 📂 Signatures
- 📄 Overview.csv
- 📄 ManualSingleDrugPerturbations.csv
- …
- 📂 TFTargets
- 📄 ChipAtlas.csv
Files and folders - Content
📄 DifferentialFeatureAbundance.csv
This file holds the main results of the Comparison calculation. For each Feature in the Comparison the following values are listed, they depend on the underlying type of data (transcriptomics, proteomics, genomics, metabolomics…).
- FeatureID: PanHunter feature ID.
- EnsemblID: gene ENSEMBL ID.
- Symbol: gene symbol.
- Name: Human readable name of the feature.
- Abundance: Average abundance of the feature across denominator samples.
- FDR: P-value adjusted for multiple testing.
- Pvalue: P-value as it is reported by limma or DeSeq2.
- SE: (optional) Standard error as it is reported by limma.
- logFC: Log2 fold change as it is reported by limma or DeSeq2. Please note, that currently fold change shrinkage is not applied.
- sig: Binary value, telling whether a feature is significantly regulated.
📄 Metadata.json
The file contains Comparison metadata in JSON format. This is - for instance - the internal Comparison ID, computation date, user-id, the method and input parameters used to calculate the Comparison, list of samples used, or filter steps applied to sample table. In principle this is the same information as displayed in the table “Comparisons Overview” in the Comparisons app.
📄 Recipe.json
This file holds instructions for PanHunter about how to create the Comparison. This is a JSON formatted version of the input settings provided by a user in the “New Comparison” tab in the New Comparison app:
- rules for filtering the sample table
- parameters for and type of comparison algorithm
- post-processing steps to be carried out
📄 SampleTable.csv
Table of samples used for calculating the Comparison. For each sample the file holds a number of properties, e.g., SampleID, Study, Platform, Protocol, Species. Other properties are dependent on the underlying experiment and type of sample.
📂 Enrichments
This folder contains the results of the “GO enrichment” and “Pathway enrichment” post-processing steps.
Gene Ontology
The information in these files describes the results of enrichment analyses for the GO gene sets based on the features found to be significantly regulated in the Comparison.
For each domain of the GO one file is provided:
- 📄 GOBP.csv - GO terms for biological processes
- 📄 GOCC.csv - GO terms for cellular component
- 📄 GOMF.csv - GO terms for molecular function
Please find more information about Gene Ontology (GO) database. Please see Enrichment Visualization app documentation for more information.
Wikipathways
The information in these files describes the results of enrichment analyses for the Wikipathways gene sets based on the features found to be significantly regulated in the Comparison For example, it provides statistical values from the Wilcoxon, Kolmogorov-Smirnov and Fisher (exact) tests and was computed based on data from Wikipathways. For each available species, a separate file is provided,
For example:
- 📄 Wikipathways_Rn.csv - Information about organism-specific pathways for Rattus norvegicus
Please see Pathway Visualization App documentation for more information.
📂 FilteredOut
This folder contains CSV file for the features filtered out based on their abundance across the samples used in the Comparison.
For example:
- 📄 ModelBased.csv - contains all features that were removed by the model-based filtration step.
📂 Networks
This folder contains the results of the “Subnetwork extraction” post-processing step.
📂 Biogrid
The files hold information about the gene/protein interaction networks enriched with the features found to be significantly regulated in the Comparison. For each available species, a file is provided with references to subnetworks in the Biological General Repository for Interaction Datasets (BioGRID).
For example:
- 📄 Hs.csv - Homo sapiens
- 📄 Rn.csv - Rattus norvegicus
Please see Network Visualization documentation for more information.
📂 Signatures
This folder contains the result of the “Signature analysis” post-processing step. There is an overview file with summary information and one file for each signature collection analysis that has been carried out. The latter contain various statistics and tests in order to identify signatures that are similar or opposite to the Comparison results.
For example:
- 📄 Overview.csv - Overview file with the signature collections for which the analyses was done.
- 📄 ManualSingleDrugPerturbations.csv - File with the results of signature analyses for a particular signature collection (“ManualSingleDrugPerturbations” in this case). Each row in this file represents an individual signature, its annotation, and results of the directed enrichment analyses based on the features found to be significantly regulated in the Comparison.
Please see Signature Visualization documentation for more information.
📂 TFTargets
This folder contains the results of the “TF analysis” post-processing step. The files contain several statistical values to identify Transcription Factors (TFs) whose target genes are overrepresented in the Comparison.
For example:
- 📄 ChipAtlas.csv - This data is compiled by utilizing the ChipAtlas dataset.
Please see TF Targets documentation for more information.