Cross Comparison
The Cross Comparison app streamlines the analysis of samples from diverse omics datasets. Users can link and visualize samples in dimension reduction plots, aiding in identifying similarities, differences, and patterns across datasets. This tool enhances the integration and comparison of samples, allowing users to split or match them according to their preferences, thus enabling more tailored analyses.
Sample selection
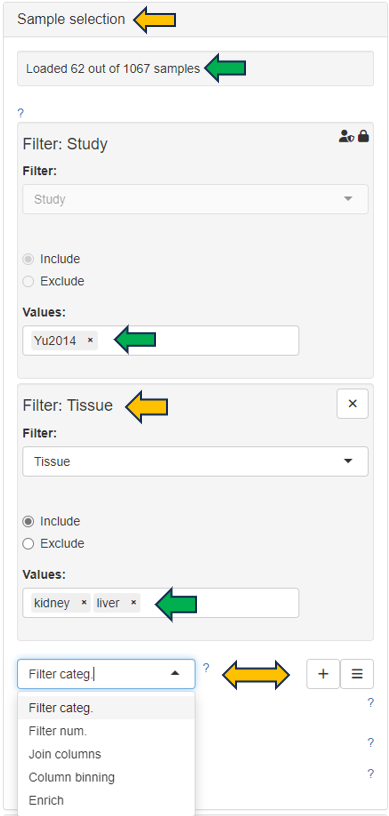
Samples can be selected through the “Sample selection” option located on the left side of the interface. The Sample Selector provides a variety of filters and other operations, called "Modifiers", that can be used to narrow down the samples selected from the entire catalogue of samples in your project to the ones you are interested in.

The Cross Comparison app offers a panel on top of the interface with options like “Split samples by” and “Match samples by”, enabling users to customize sample grouping based on their interests. This functionality allows for flexible manipulation of datasets, enhancing the precision and relevance of the analysis to the user’s research objectives.

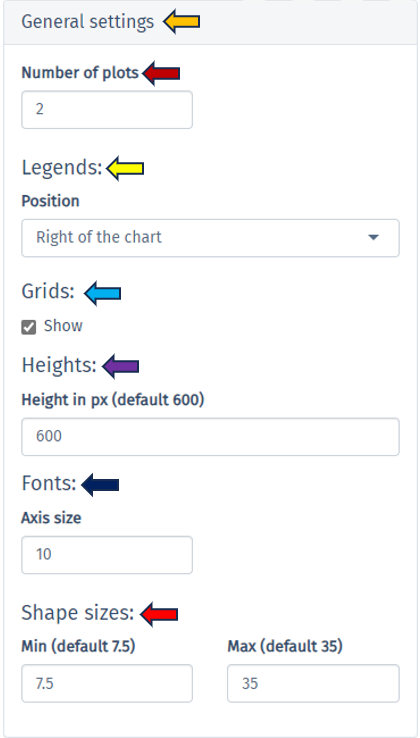
On the top-right of the page, you will find the “General Settings” panel, providing options to customize your plots for data analyses.

Dimension reduction Plots
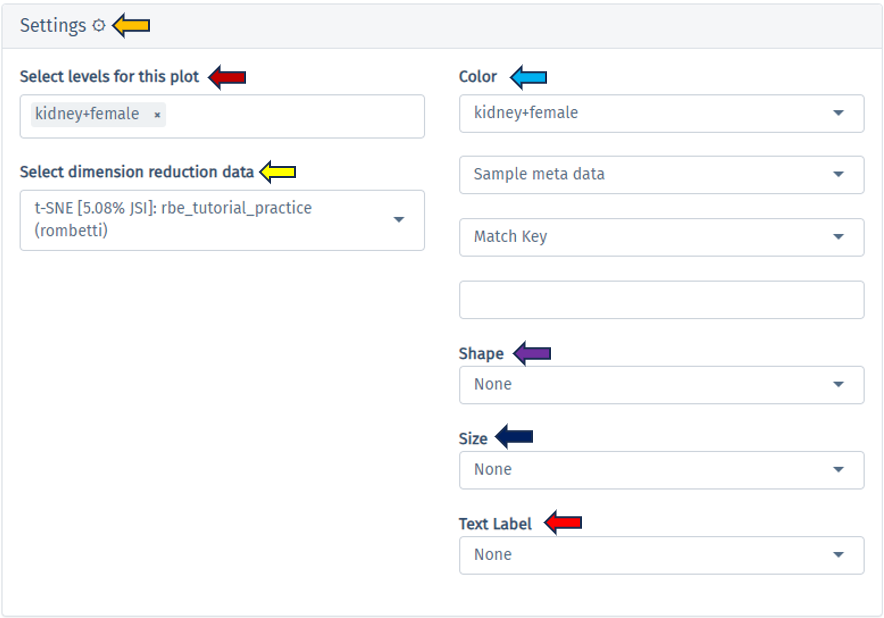
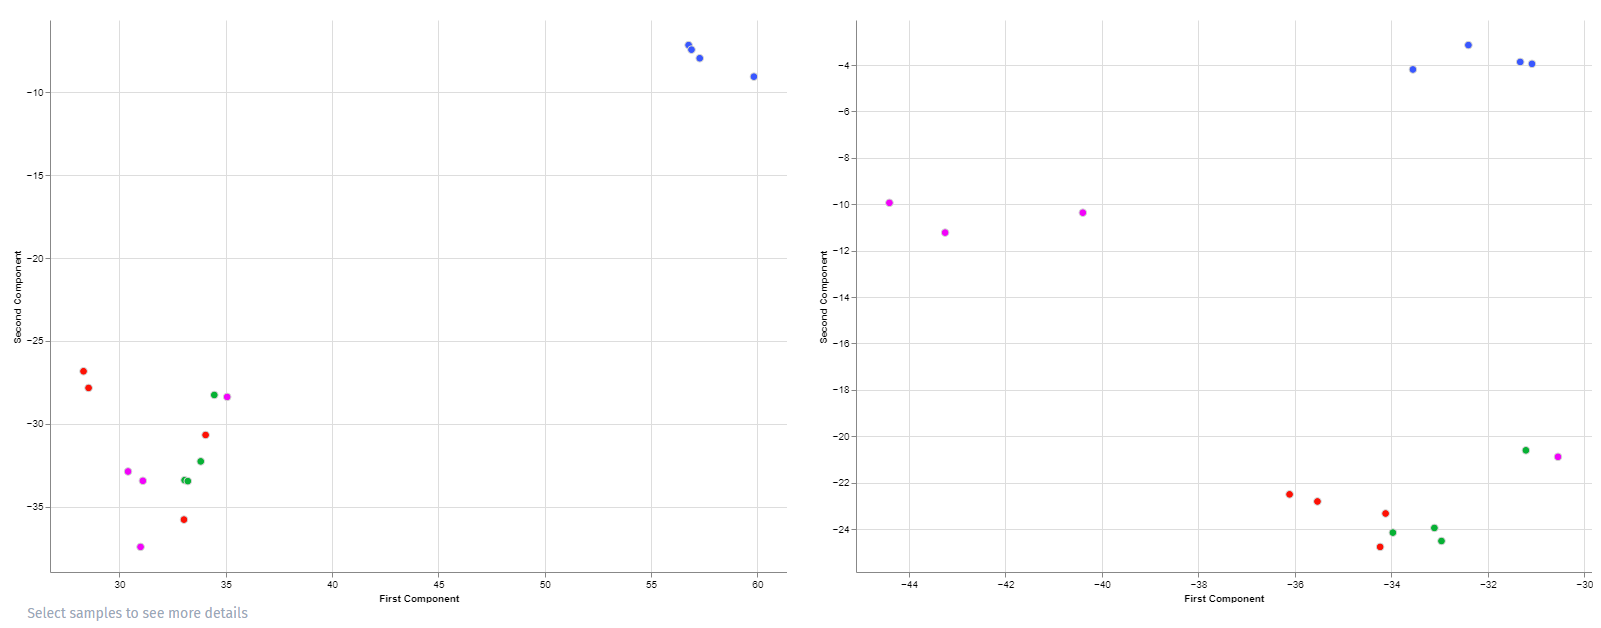
In the “Dimension Reduction Plot” tab, each plot illustrates samples from a specific split-factor in dimension-reduced coordinates. Additionally, there’s a “Settings” panel above the plots, for fine-tuning each plot according to the user’s preferences, ensuring detailed and streamlined visualization. Hovering over the dots in the plot provides information on the corresponding samples, while selecting samples enables more specific visualization by highlighting them accordingly. This feature enhances user interaction and facilitates deeper exploration of the data.

Here is an example plot comparing Tissue: “Kidney” and “Liver” in a female rat

Similarly, you’ll find tabs for “Analyses Few Matches Key,” “Analyses Single Feature,” and “MA/Volcano Analyses” for data analysis through various plot types, providing comprehensive tools for in-depth exploration and interpretation.