The Big Picture: Viewing Project Activities
On the Activities page, a project leader gets access to usage information on the projects they lead.
Choosing A Time Interval
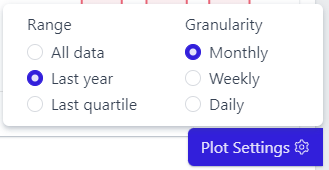
Clicking Plot Settings in the bottom right corner reveals a menu governing all graphs on the page, allowing to choose the time period covered and the granularity of the interval displayed.
Project Information
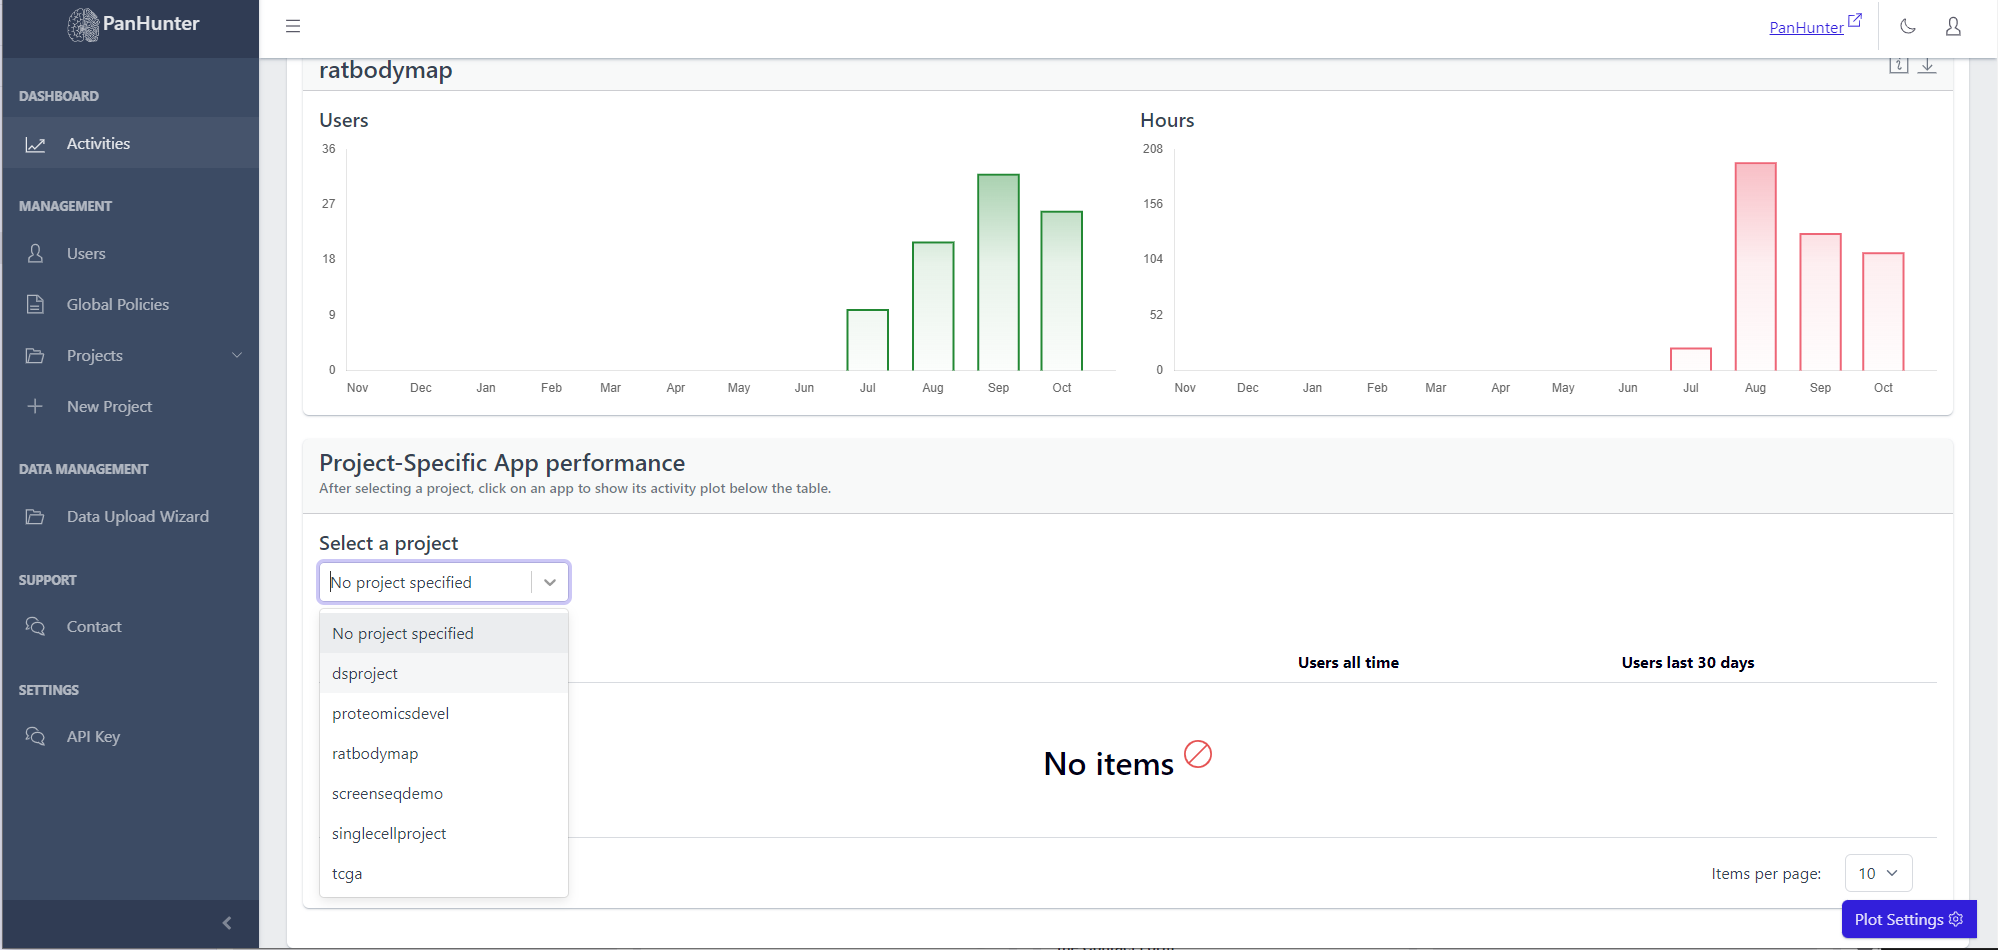
To access this, go to Activities in the sidebar,and go to the Projects tab and scroll down. Displayed is a table with the names of the projects, the number of users who ever accessed this project, and the number of users who accessed this project in the last 30 days.
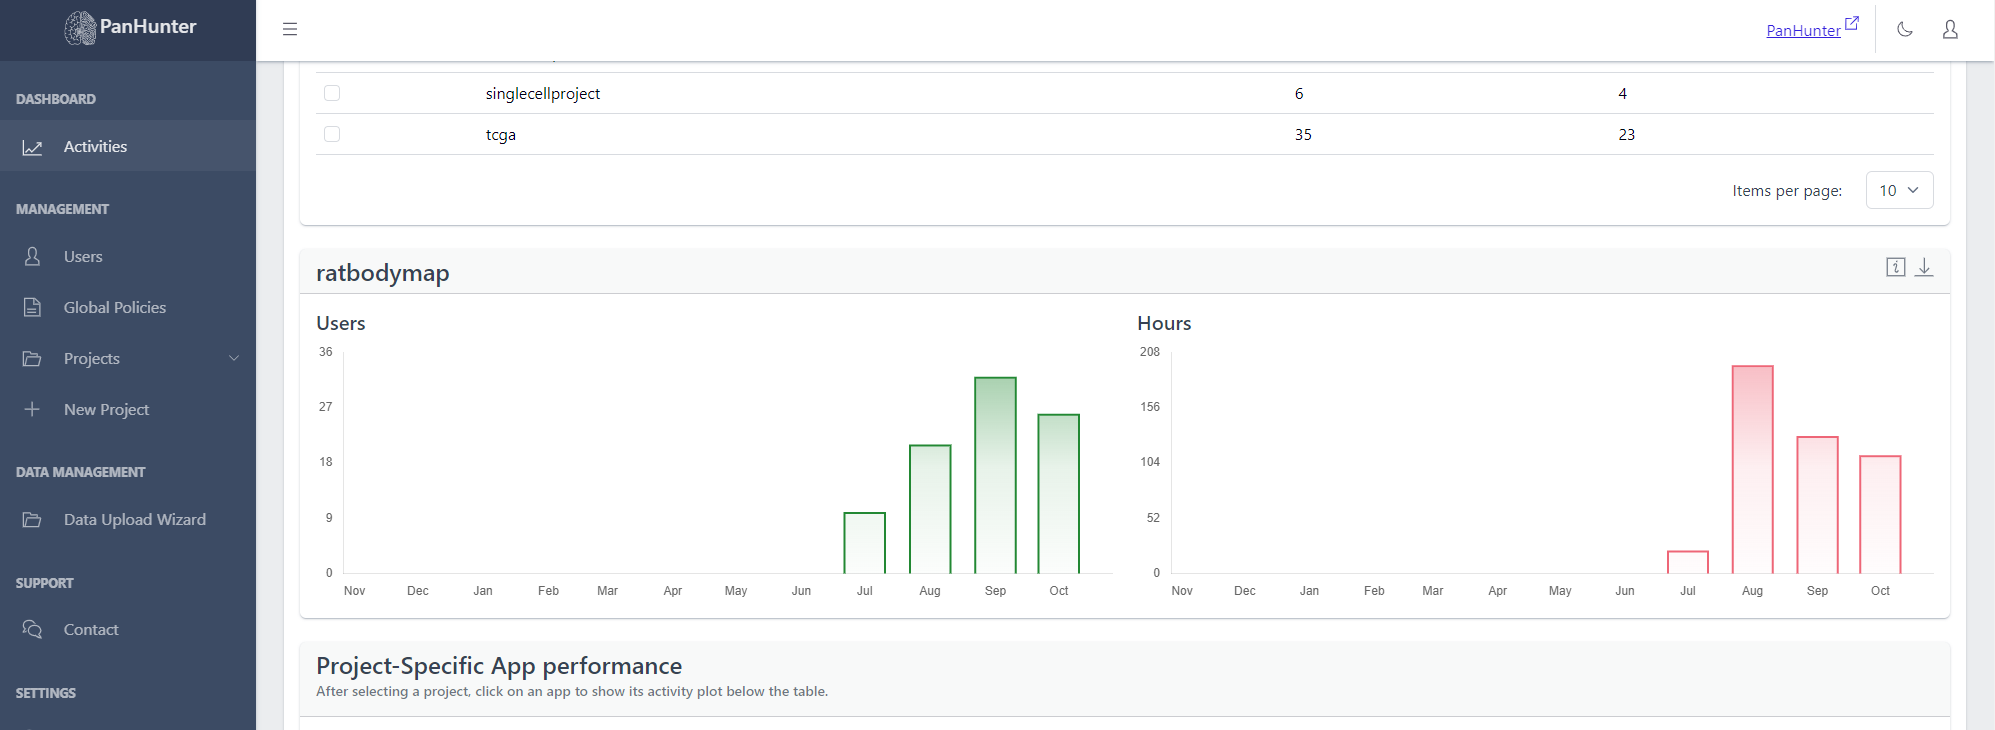
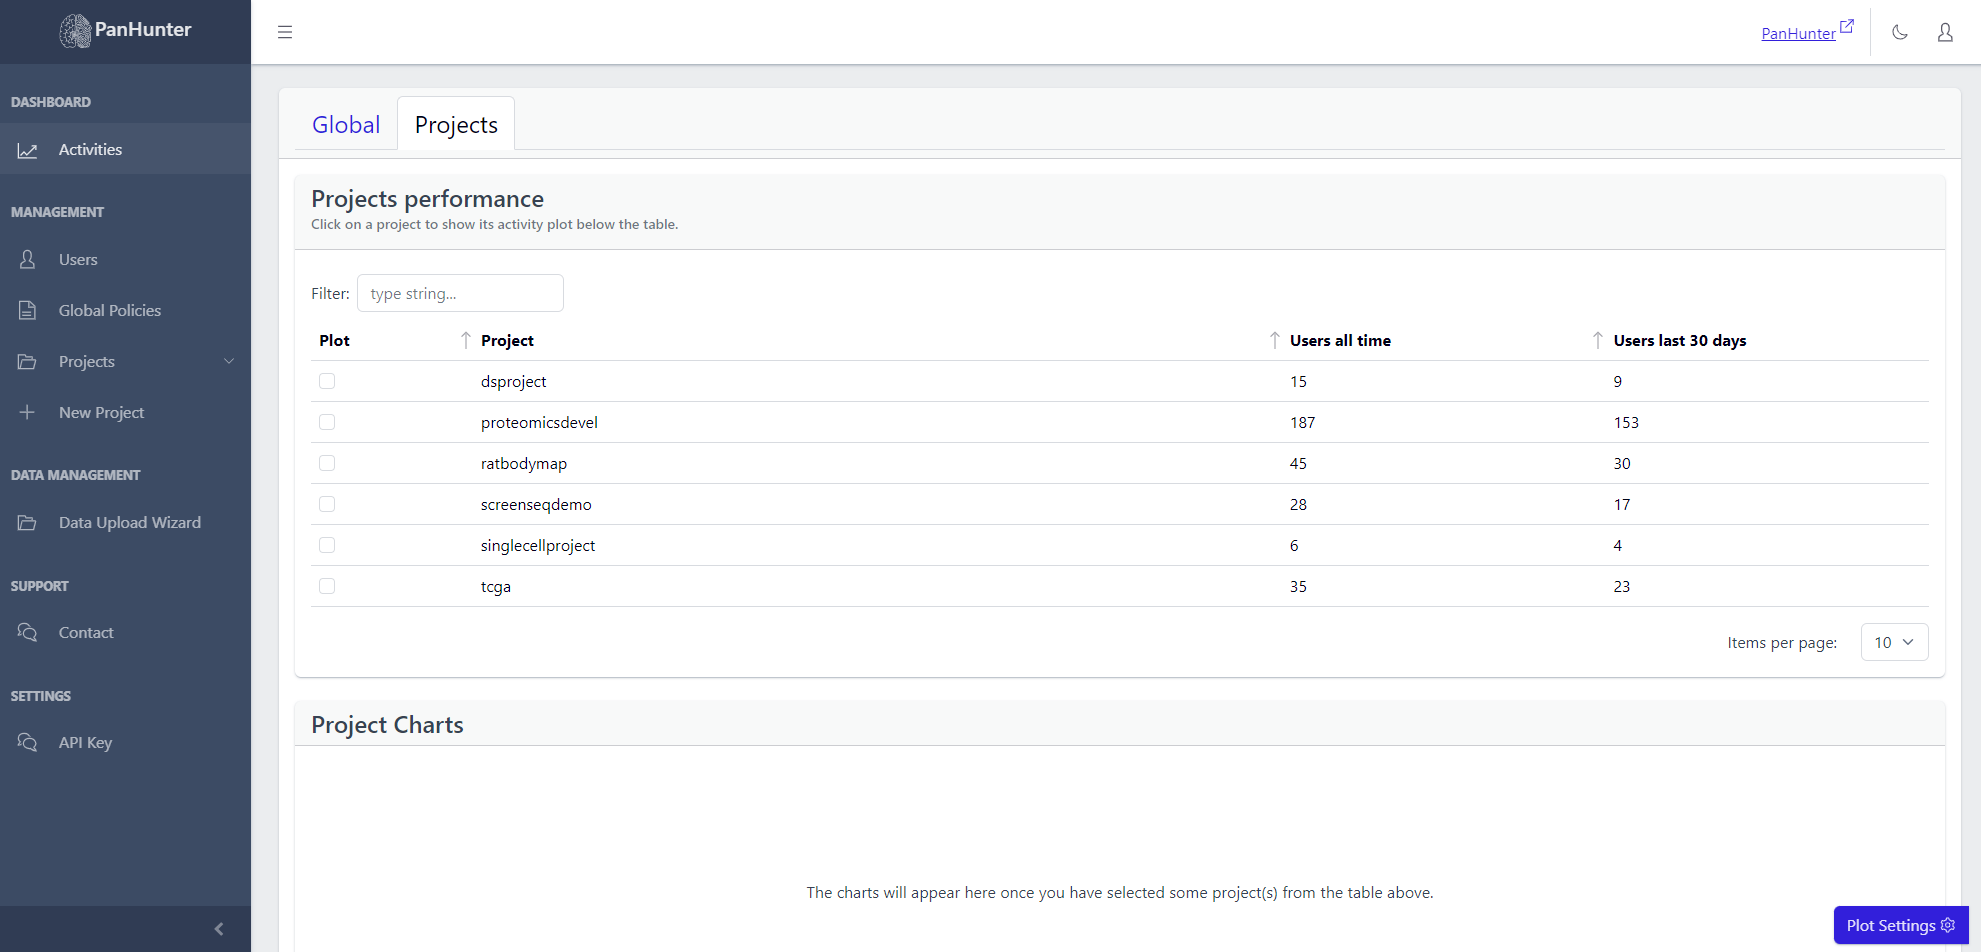 Selecting a row displays additional plots with the number of active users, and number of active hours, for this project.
Project-Specific App Information
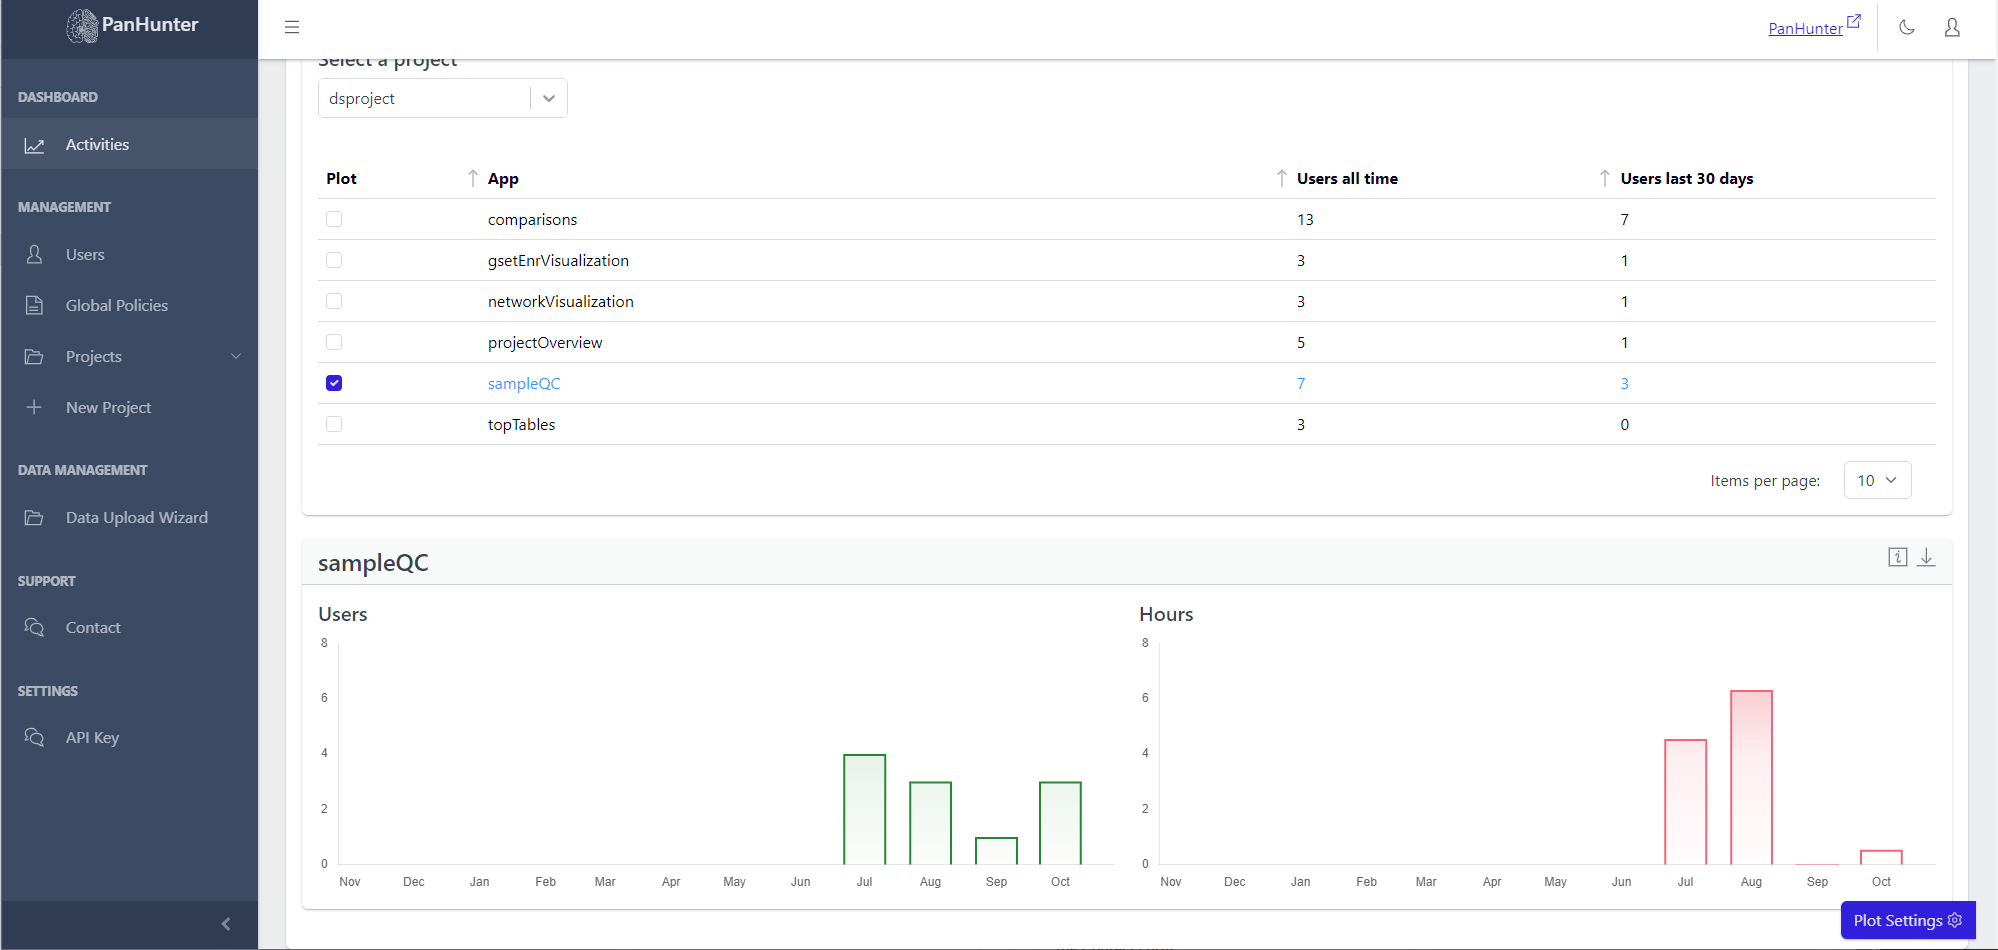
To access this, go to Activities in the sidebar, go to the Projects tab and scroll down. Then, select the desired project from the Select a Project dropdown list.
 Displayed is a table with the names of the apps, the number of users who ever accessed this app, and the number of users who accessed this app in the last 30 days.
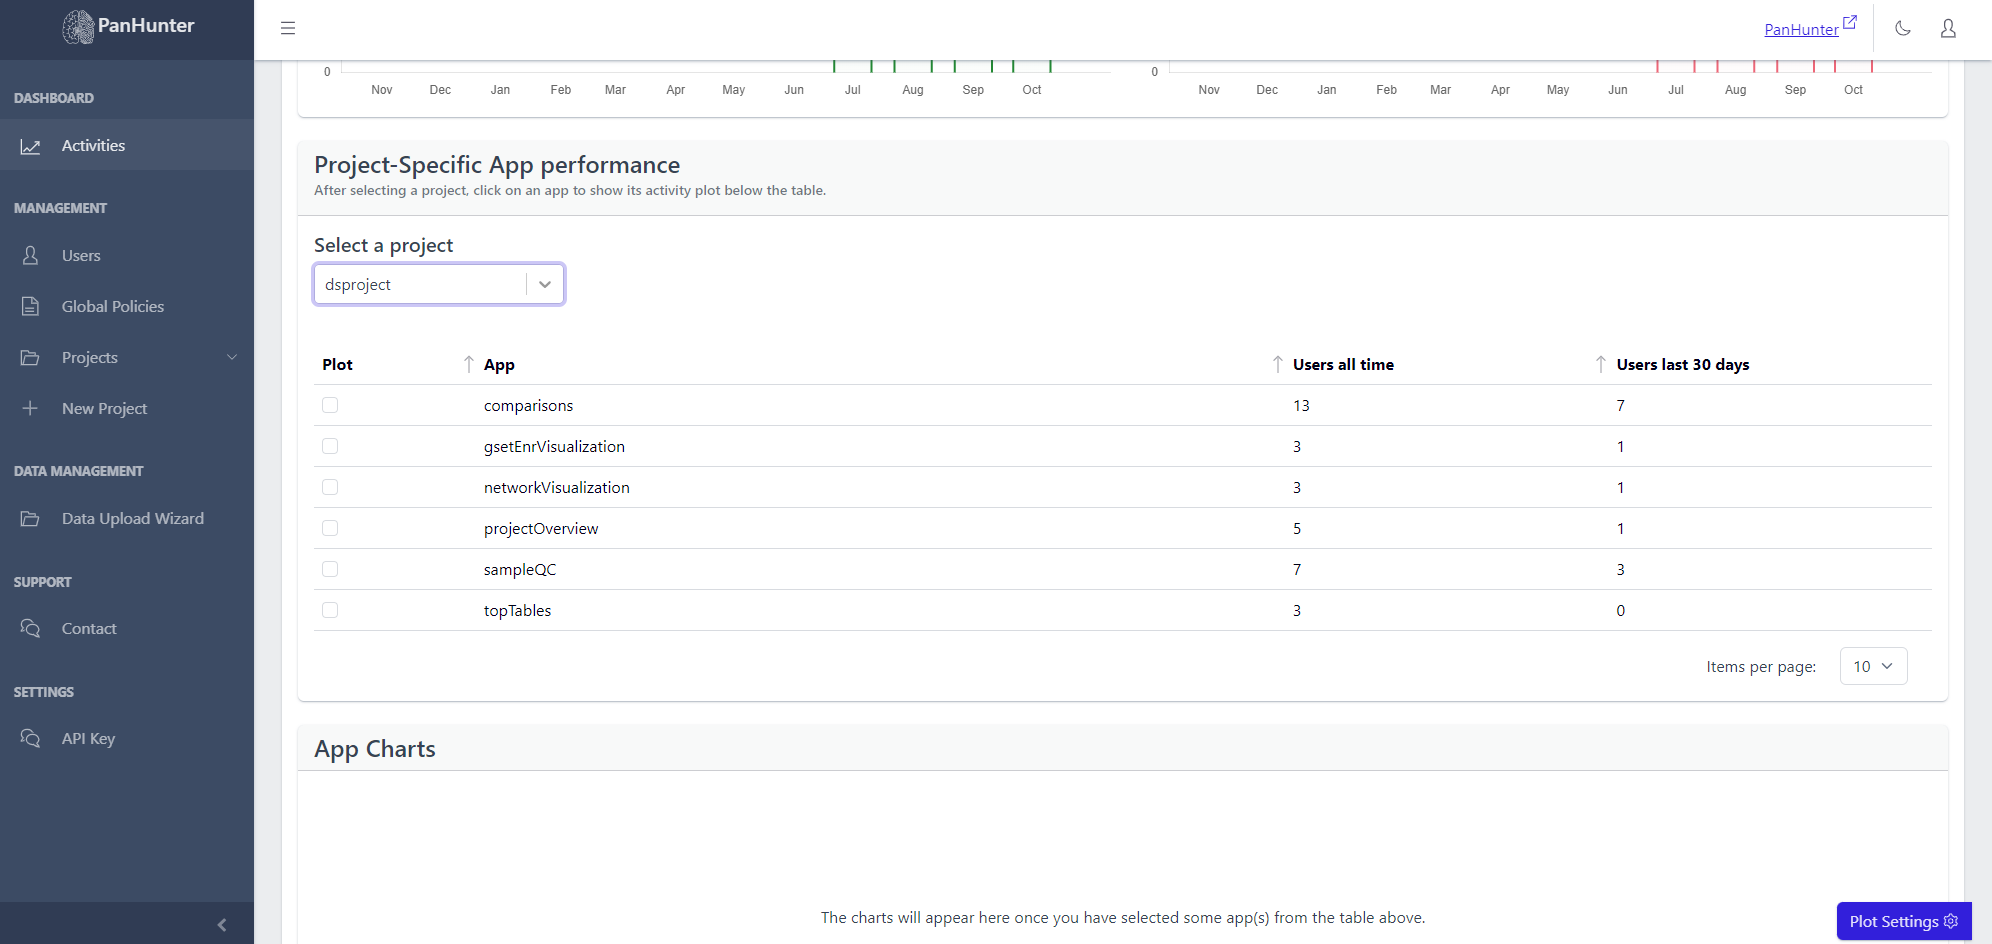 Selecting a row displays additional plots with the number of active users, and number of active hours, for this app.