A Better Picture: A Global Overview In The Activities Tab
On the Activities page, an administrator can see how many users regularly login to PanHunter, how many projects currently exist, and get additional information on overall app usage in addition to the project information a project leader has access to. Hovering over one of the plot bars gives exact numbers.
Choosing a time Interval
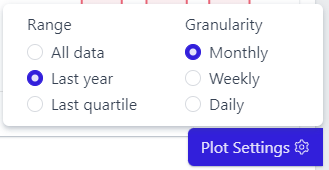 Clicking Plot Settings in the bottom right corner reveals a menu governing all graphs on the page, allowing to choose the time period covered and the granularity of the interval displayed.
Global Information
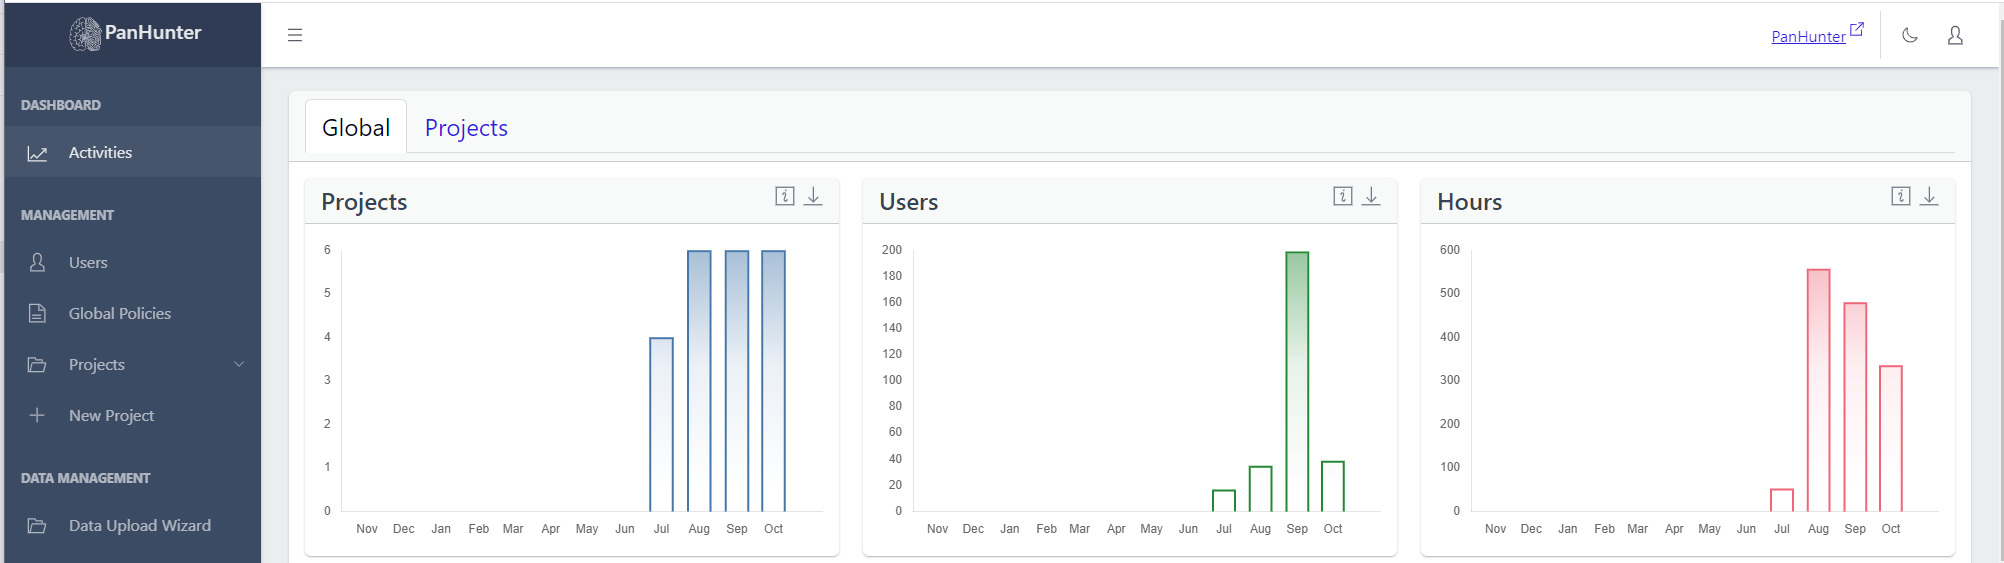 Displayed are the number of active projects (projects present in at least one user’s browser tabs), number of active users (users with PanHunter open), and number of active hours (total amount of time in hours that PanHunter was opened in user’s browser tabs). This data is aggregated across all projects. To get more information about a specific project, see here.
App Information
To access this, go to Activities, go to the Global tab and scroll down.
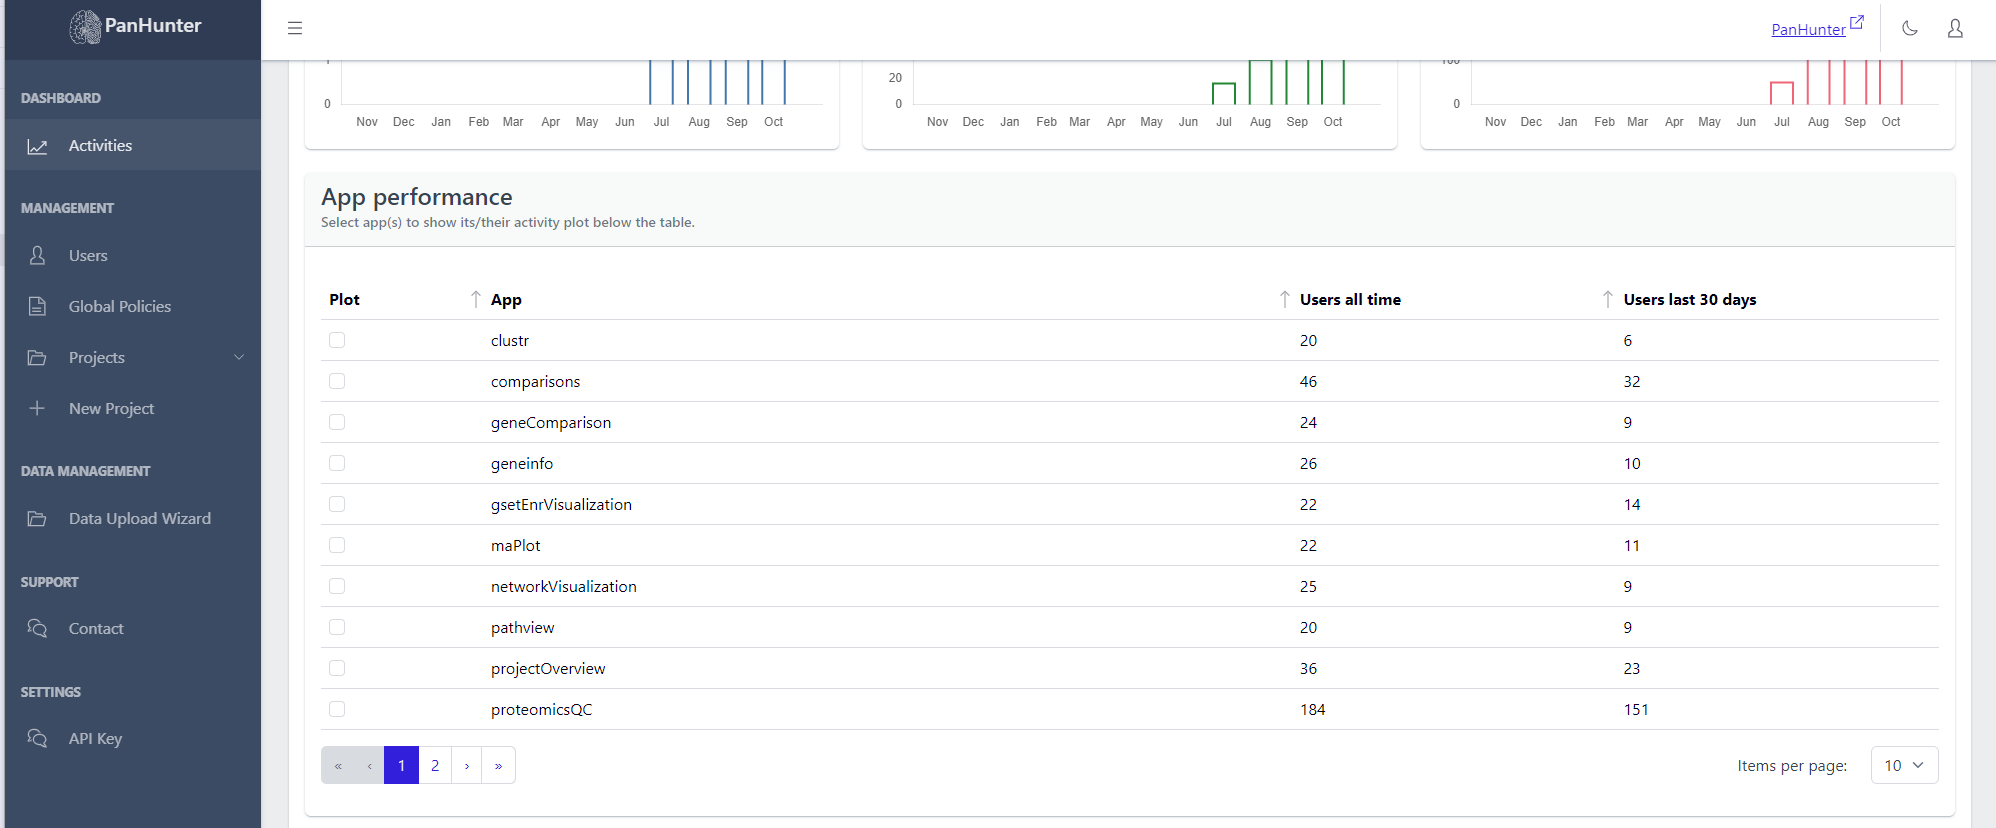
Displayed is a table with the names of the apps, the number of users who ever accessed this app, and the number of users who accessed this app in the last 30 days. Selecting a row displays additional plots with the number of active users, and number of active hours, for this app.
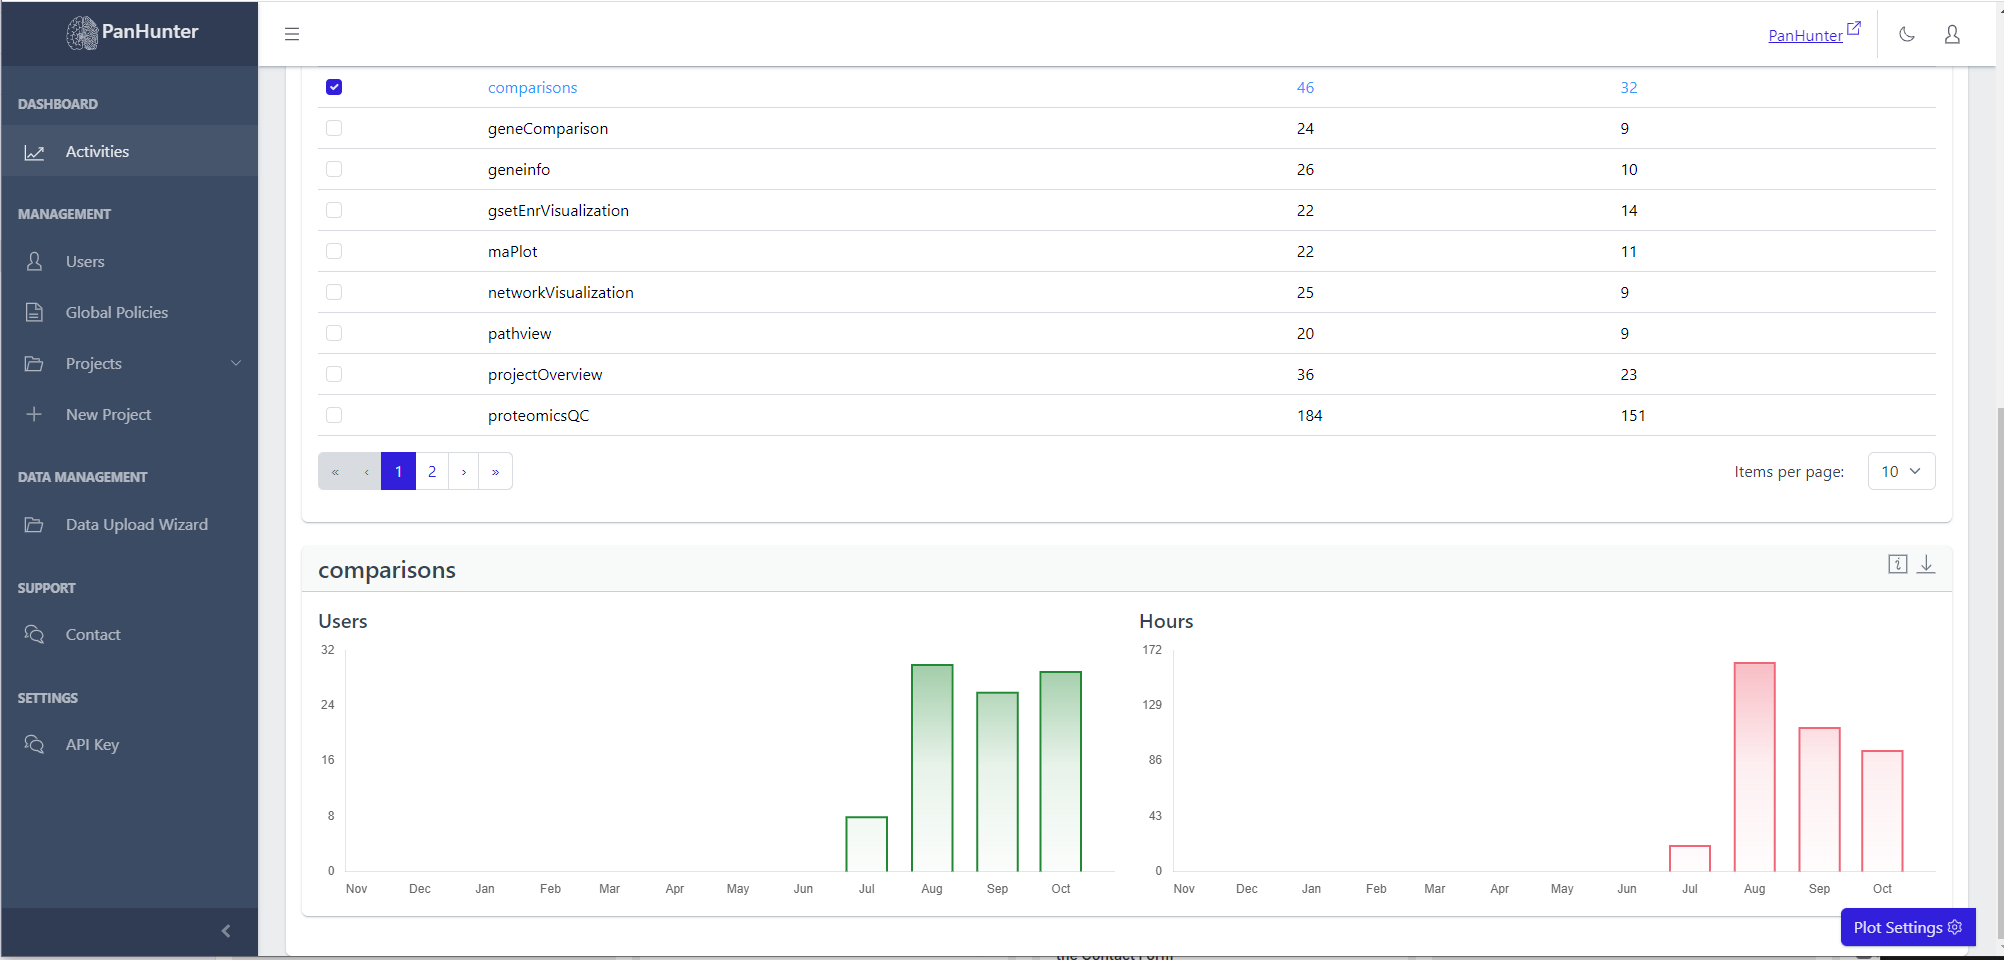
This data is aggregated across all projects. To get access to information about an app within a project, see here.