PanHunter Apps
Start Page
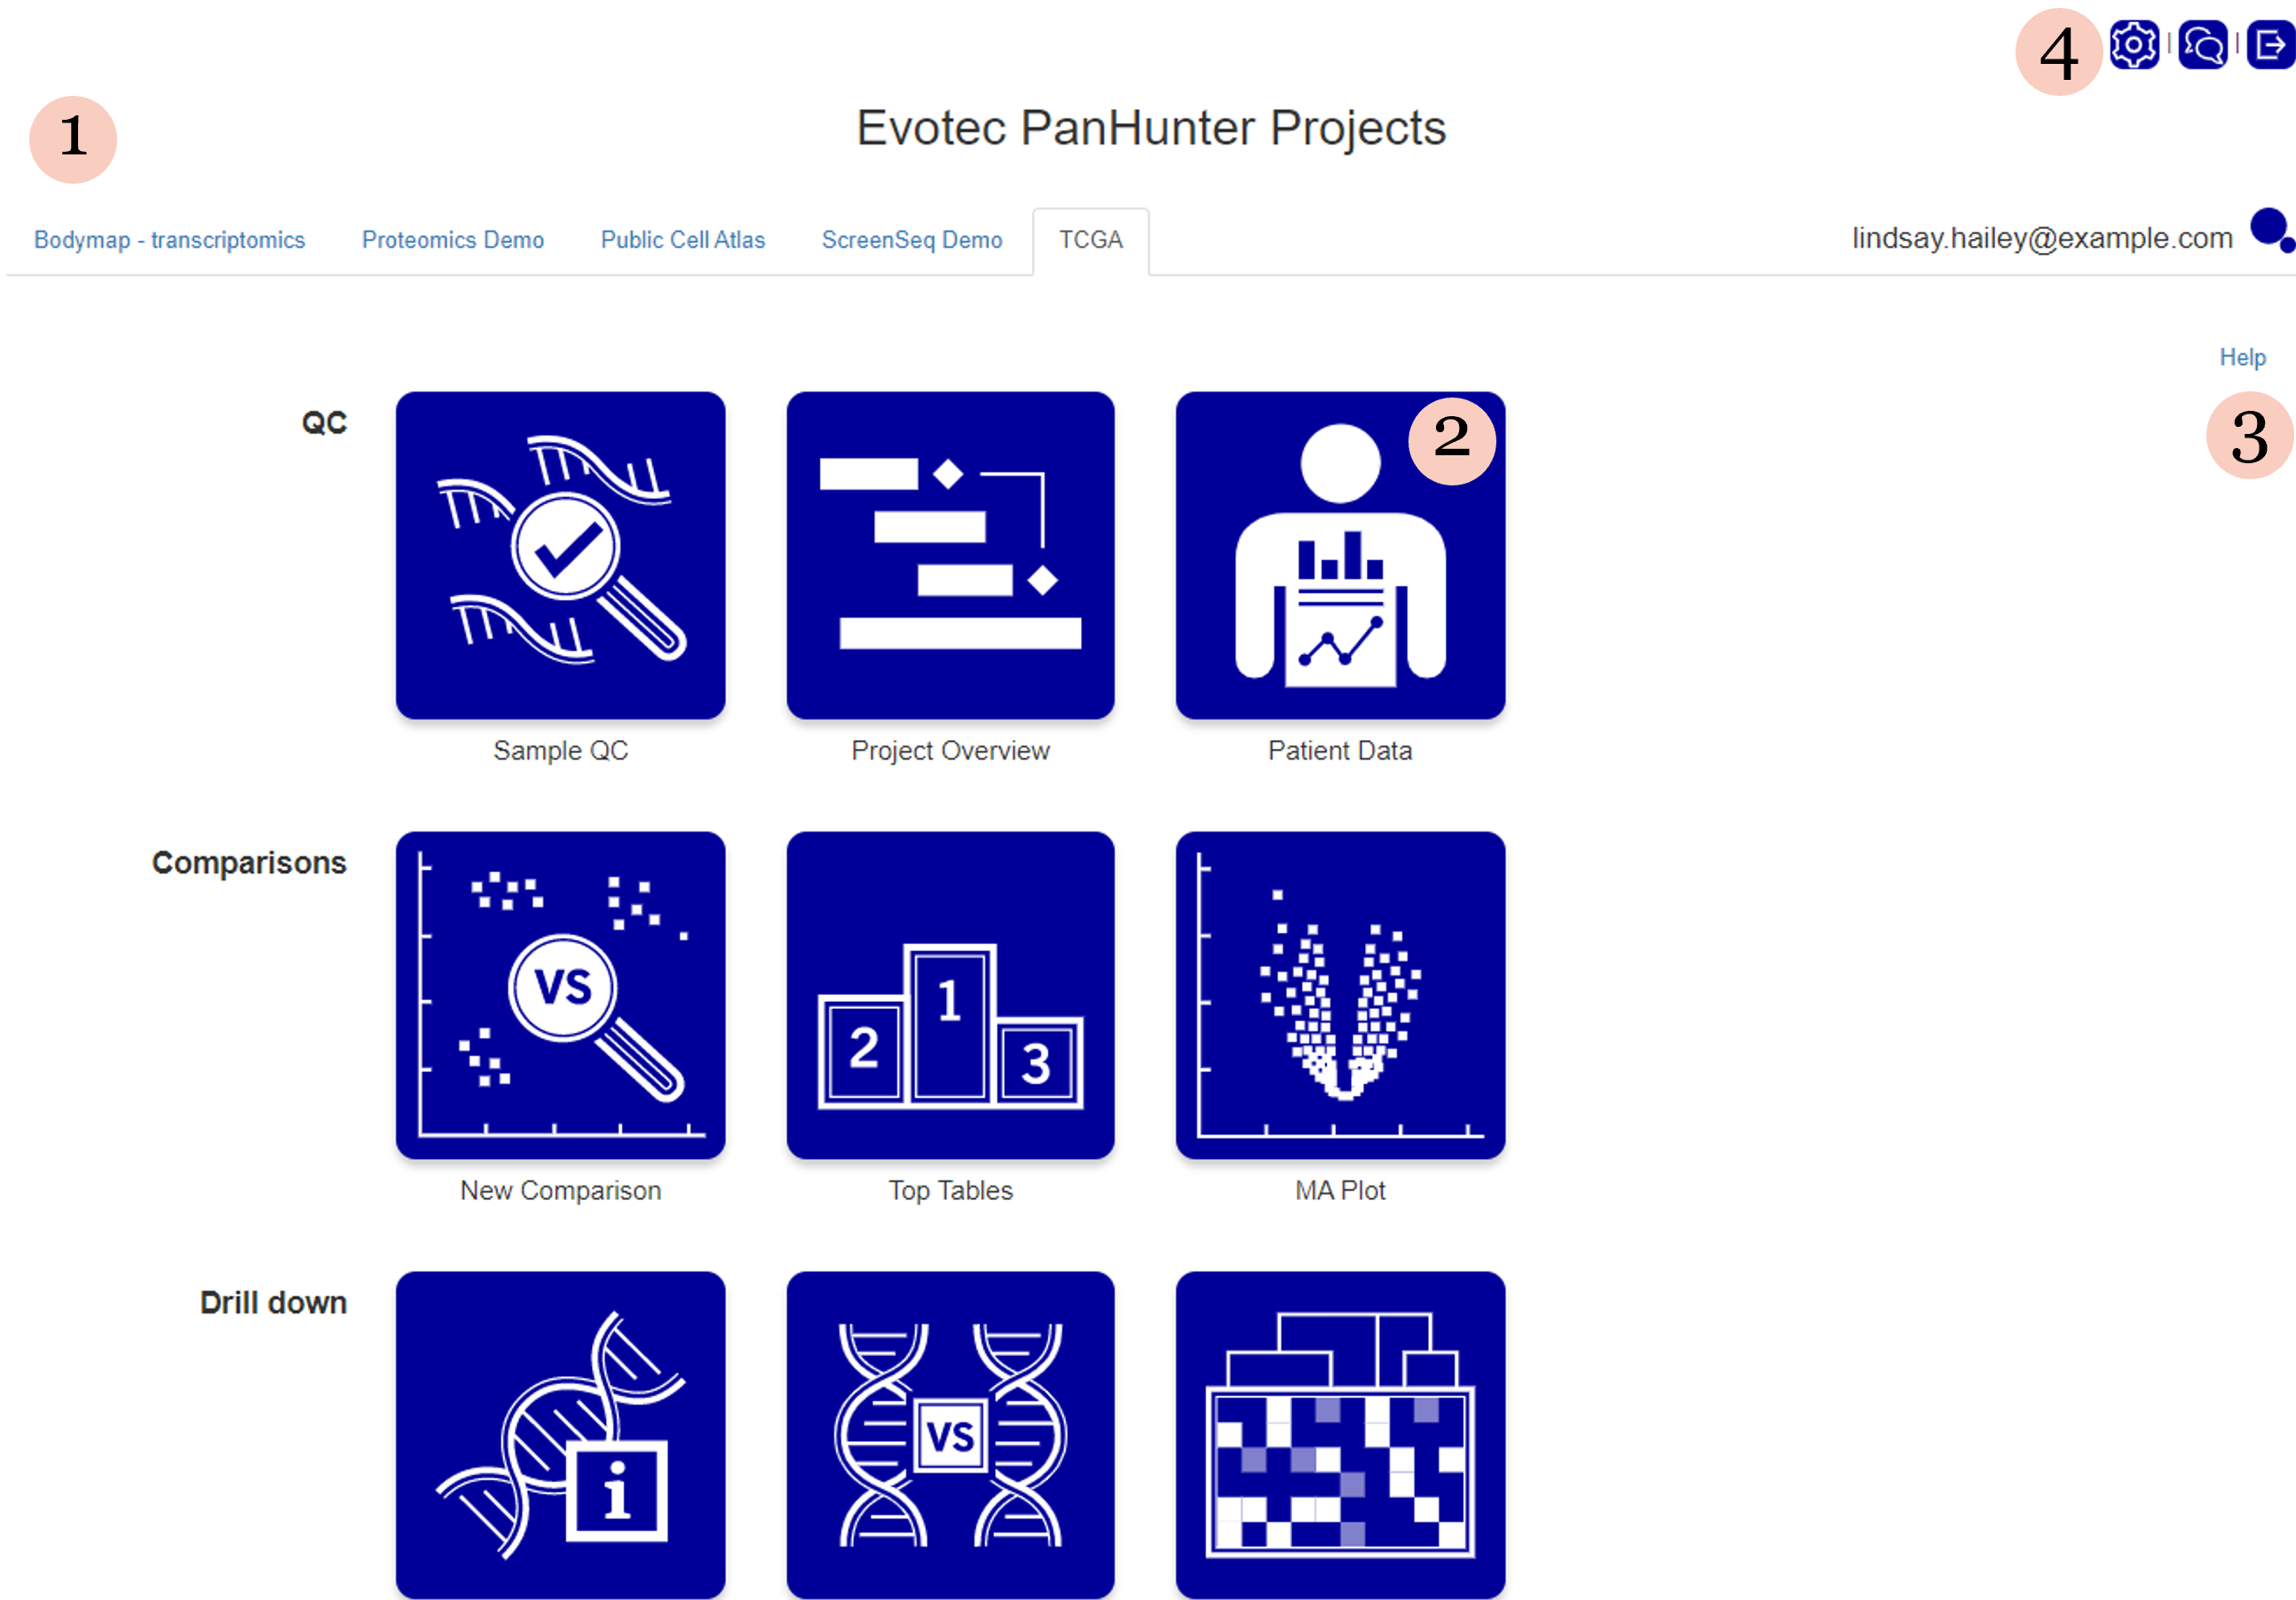
Start page provides a centralised destination to switch between projects and dive into your data from any of the PanHunter applications.
- Project bar lists all PanHunter projects you are involving in. Simply click on the project name to access the project.
- Application catalogue includes core applications suitable for all analysis workflows as well as project-specific applications such as Patient Data, scRNA-Seq Browser etc.
- Help document provides detailed information of all PanHunter applications and algorithms.
- Administration and support buttons guides you to the admin app for managing your projects and the contact form for sending enquiries and reporting issues.

Application
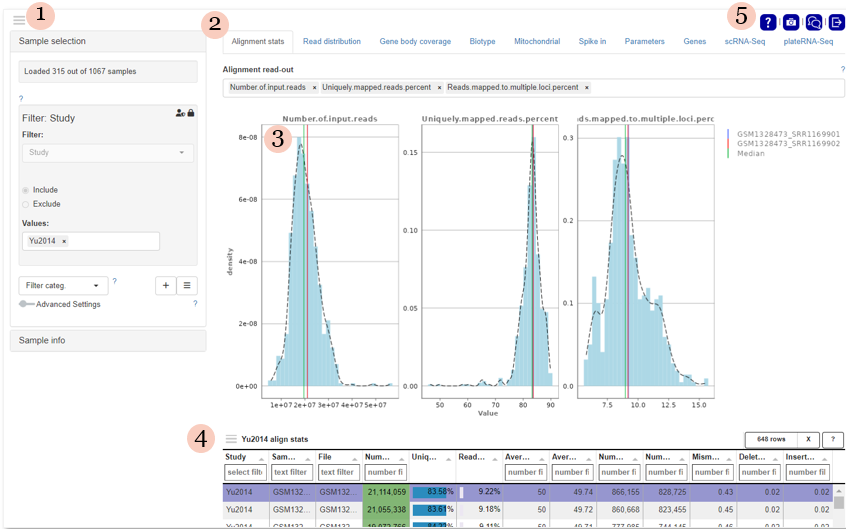
An application includes analysis features dedicated for a specific step in your data analysis workflow.
- Selection & configuration panel allows selection and combination of studies and samples, as well as the configuration of analysis parameters and plot options. The panel and all included sections are collapsible.
- Analysis bar lists relevant aspects and analyses in the selected application.
- Plots in PanHunter are interactive, customisable and downloadable.
- Tables can be filtered and customised by clicking on ≡ symbol.
- Help and snapshot buttons provide detailed explanations and create interactive snapshots.

Sample QC App
The Sample QC app is utilised to ensure sample quality, with an emphasis on RNA-seq and similar platforms. The application presents data supplied by the STAR aligner tool, Samtools, and the HTSeq package.
For more information go to Sample QC page.
Proteomics QC App
The Proteomics QC app is a comprehensive tool designed to streamline and enhance quality control processes in proteomics research. It offers features for assessing data integrity, identifying anomalies, and ensuring the reliability of protein analysis results.
For more information go to Proteomics QC page.
Project Overview App
Projects in transcriptomics can hold multiple studies, aggregating data from different experiments. This allows to compare data generated on different technology platforms, different protocols and different biological systems. The Project Overview app provides an overview of the data sets with the current project.
For more information go to Project Overview page.
scExplorer App
The scExplorer app is mainly used to visualize single cell rna seq data and to annotate different cell types.
For more information go to scExplorer App page.
Patient Data App
The Patient Data app is used to explore rich clinical data of patients, to link patient data with gene expression samples, and to calculate univariate statistics.
For more information go to Patient Data page.
New Comparison App
The New Comparison app is used to visualize samples and create top tables of differentially expressed genes, following a comparison of specific sample groups (for instance, representing distinct treatments). The resulting tables can then be reviewed with the Top Tables application.
For more information go to New Comparison page.
Comparisons App
The Comparisons app is used to inspect and compare tables of differentially expressed genes as generated in the New Comparisons app.
For more information go to Comparisons page.
MA Plot App
The MA Plot app is used to visualize and inspect the log fold changes (M) vs. average expression levels of the contrast denominator (A) for genes from two Comparisons (refer TopTables app).
For more information go to MA Plot page.
Cross Comparison
For information go to Cross Comparisons page.
Gene Info App
The gene info app provides all available information regarding a single gene of interest.
For more information go to Gene info page.
Gene Comparison App
The Gene Comparison app provides a heatmap visualization of average expression levels similar to the gene info app, but for multiple selected genes.
For more information go to Gene Comparisons page.
Gene Clustering App
The Gene Clustering app aims to identify co-expressed or co-regulated genes for a single selected gene.
For more information go to Gene Clustering page.
TF Targets App
The TF Targets app provides a user-friendly platform for exploring the intricate network of transcription factors (TFs) and their target genes.
For more information go to TF Targets page.
Pathway Mapping App
The pathview app was designed to visualize and quickly compare fold change values of genes present in one or two top tables in the context of organism-specific pathway maps.
For more information go to Pathway Mapping page.
Network Visualization App
The network visualization app provides an interactive visualization of top table genes in the context of gene and protein interaction networks.
For more information go to Network Visualization page.
Signature Visualization App
The signatures app provides an interactive visualization of a signature against the top table genes.
For more information go to Signature Visualization page.
Enrichment Visualization App
The Enrichment visualisation app enables conducting enrichment analysis for a provided dataset top table, an individual comparison from a comparison group or a manually entered feature (gene) list with user-defined parameters, and obtaining a visualisation of the analysis findings.
For more information go to Enrichment Visualization page.