From single-cell data to cell-type-specific differential expression
Single-cell and single-nucleus RNA-seq show the expression of every cell, but a single cell contains few reads, and cells from the same person are not independent replicates. To compare disease and control, a robust approach is to sum up the cells of each cell type per donor into one pseudobulk profile and to compare these profiles with the methods used for bulk RNA-seq.
This guide walks you through this approach. You will:
- explore a single-cell study and its cell types in the scExplorer app,
- create a pseudobulk study with one profile per donor and cell type,
- calculate a disease-versus-control comparison for every cell type in one run,
- find out which cell types respond most strongly,
- compare pathway enrichment across all cell types in a heatmap and
- look at one pathway in one cell type.
The guide takes about 45 minutes, most of it waiting for calculations.
Before you start
- Access: You need access to a PanHunter project with single-cell data and the apps scExplorer, New Comparison [v2], Comparisons, Enrichment Visualization and Pathway Mapping, and permission to calculate comparisons.
- Example data: The guide uses the study Hs_Heart_KoenigSn2022, a public single-nucleus RNA-seq study of human hearts by Koenig et al. (2022, Nature Cardiovascular Research). It contains about 220,000 nuclei from 25 healthy donor hearts and 13 hearts with dilated cardiomyopathy (DCM), annotated with 15 cell types. If your project does not contain this study, follow the same steps with your own single-cell study.
- Background: For the statistics of the comparison, see Differential gene expression analysis. The guide From differential expression to pathway enrichment explains the comparison set-up and the enrichment analysis for a single comparison in more detail.
Step 1: Explore the cell types
- Open the scExplorer app from the start page of your project.
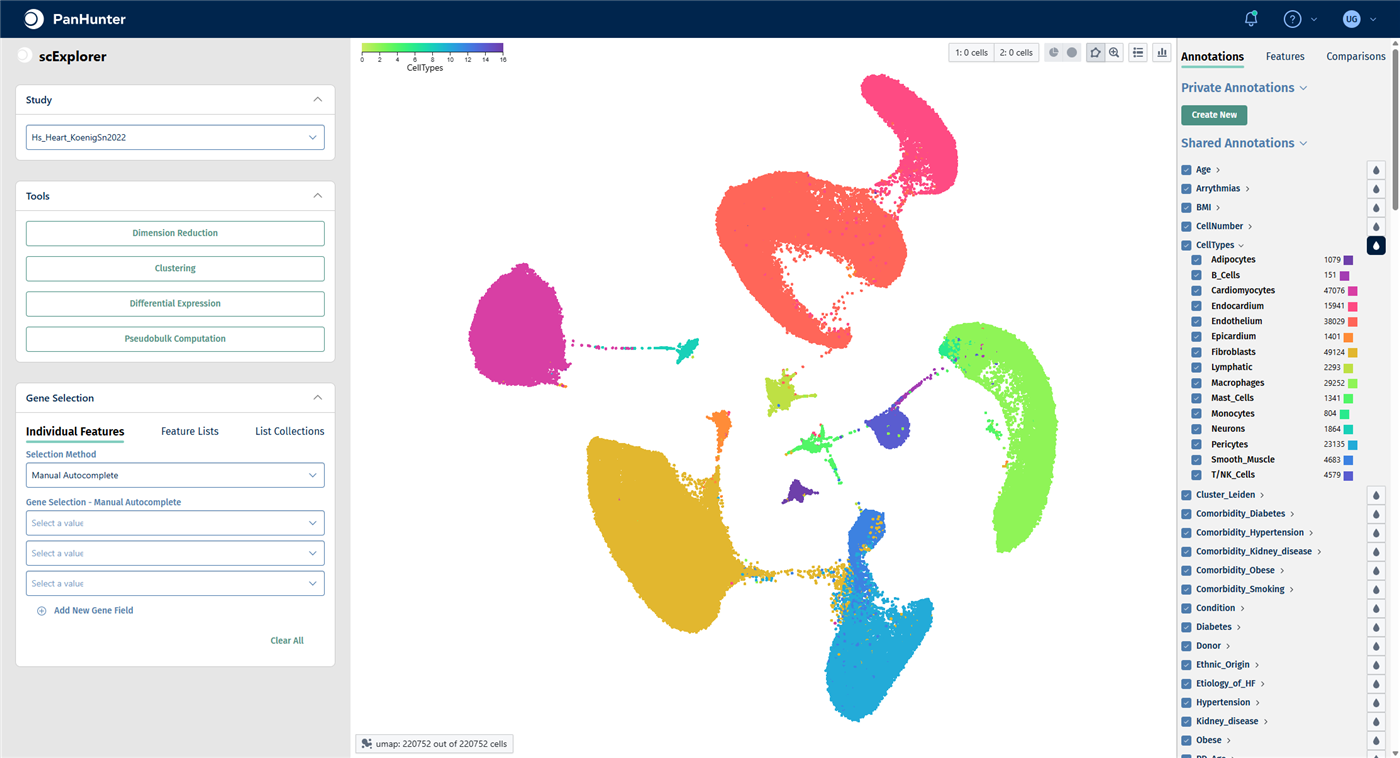
- In the Study panel, select Hs_Heart_KoenigSn2022. The cells are shown in a UMAP embedding.
- In the right-hand panel, open the Annotations tab. Under Shared Annotations, click the droplet icon next to CellTypes to color the cells by cell type. Click the arrow next to CellTypes to see the list of cell types with their number of cells.
For all functions of the app, see scExplorer.
Check your result
The plot reads umap: 220752 out of 220752 cells. The 15 cell types form separate clusters; the largest populations are fibroblasts, cardiomyocytes, endothelium and macrophages.
Marker genes confirm that a cluster really is the cell type it is labeled as:
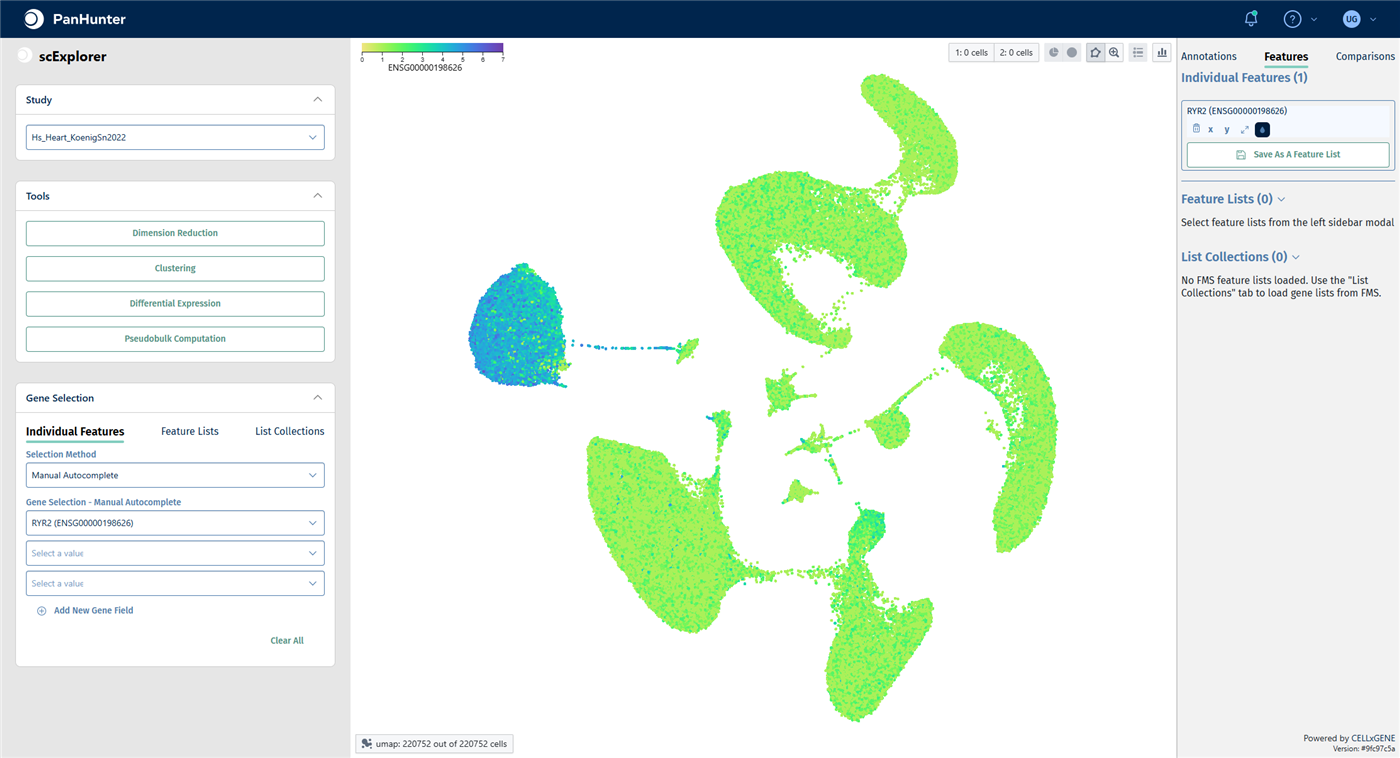
- In the Gene Selection panel on the left, click the first field under Gene Selection - Manual Autocomplete, type
RYR2and select RYR2. RYR2 is a calcium channel typical of cardiomyocytes. - The right-hand panel switches to the Features tab. Click the droplet icon below the gene to color the cells by its expression.
Check your result: marker gene
Only the cardiomyocyte cluster shows high RYR2 expression.
To see how disease and control cells are distributed within a cell type:
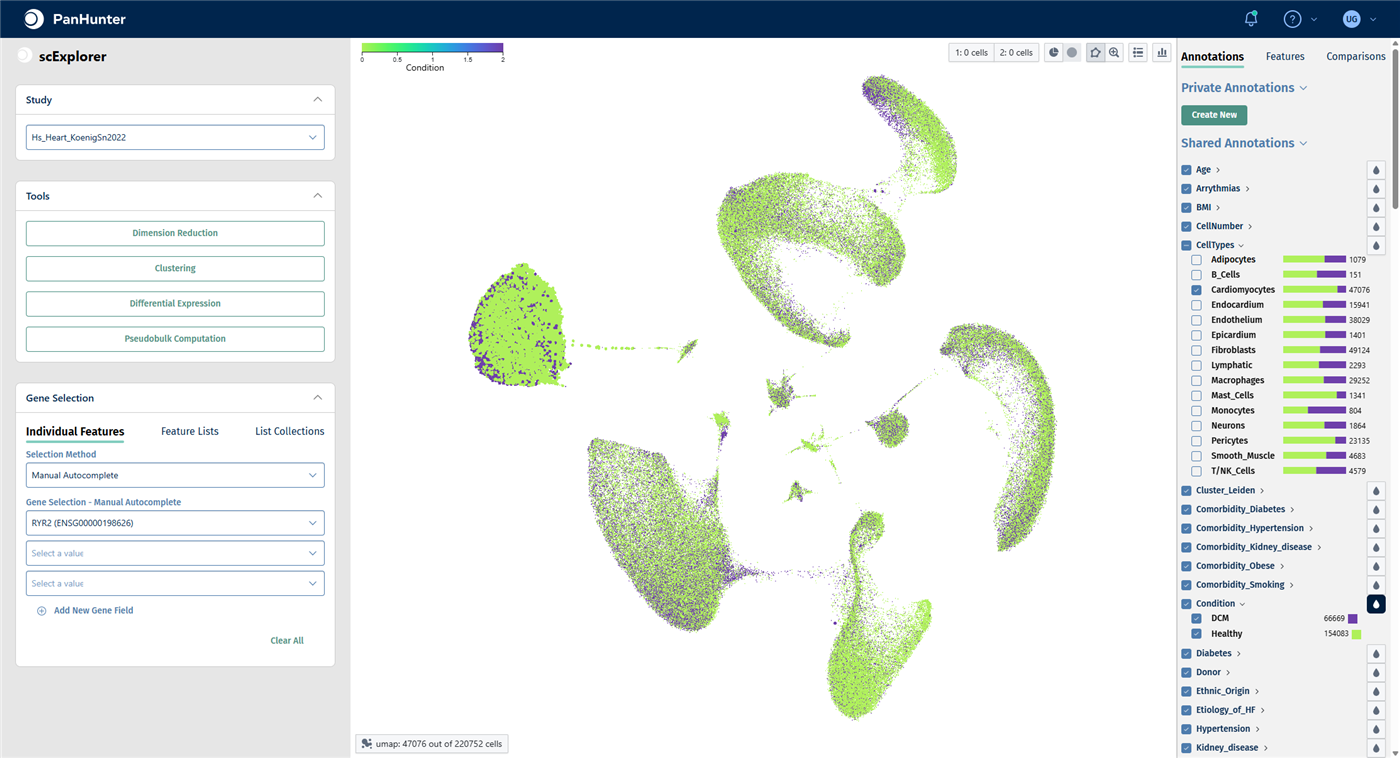
- In the Annotations tab, uncheck the box of CellTypes to deselect all cells, then check Cardiomyocytes only.
- Click the droplet icon next to Condition. The two conditions are called DCM and Healthy.
- Check the box of CellTypes again to select all cells before you continue.
Check your result: cardiomyocytes by condition
47,076 cardiomyocytes are selected; all other cells are greyed out. The bars next to each cell type show the proportion of DCM and healthy cells.
Step 2: Create a pseudobulk study
A pseudobulk study sums up the counts of all cells that share the same values in the aggregation keys. With the keys SampleID and CellTypes, you get one profile per donor sample and cell type.
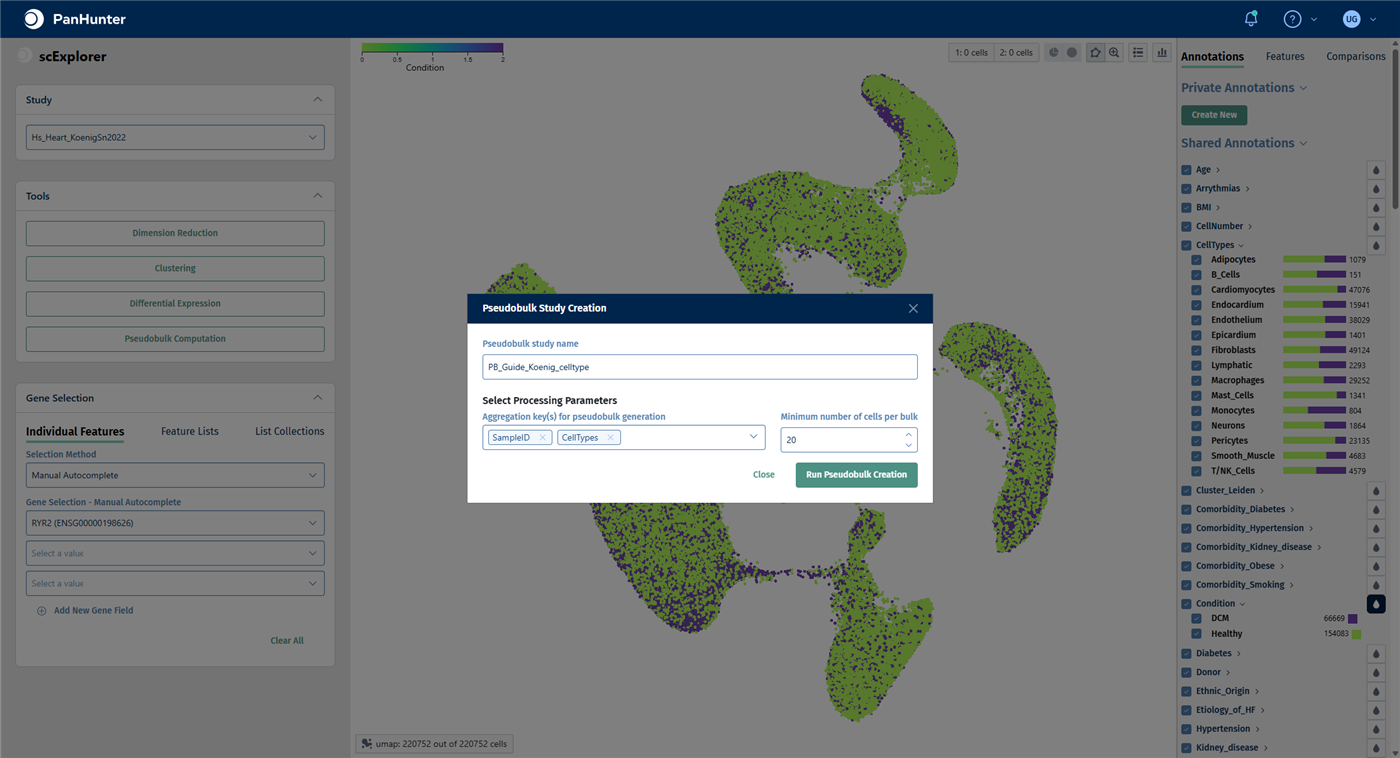
- In the Tools panel on the left, click Pseudobulk Computation. The Pseudobulk Study Creation window opens.
- Enter a Pseudobulk study name, for example
PB_Koenig_celltypes. Pseudobulk studies usually start withPB_. - In Aggregation key(s) for pseudobulk generation, keep SampleID and add CellTypes.
- Keep Minimum number of cells per bulk at 20. Profiles built from fewer cells are left out because they are too noisy.
- Make sure that all cells are selected, then click Run Pseudobulk Creation.
Check your result
When the calculation has finished, the pseudobulk study is available as a normal study in the Sample Selector of the other apps. No further approval step is needed.
Note: The project used in this guide already contains a pseudobulk study with the same design, PB_Hs_Heart_KoenigSn2022_celltype. The following steps and screenshots use it. If you created your own, select your study instead.
Step 3: Check the pseudobulk study
- Open the New Comparison [v2] app from the start page.
- In the Sample Selector, start typing the name of the pseudobulk study in Studies and select it.
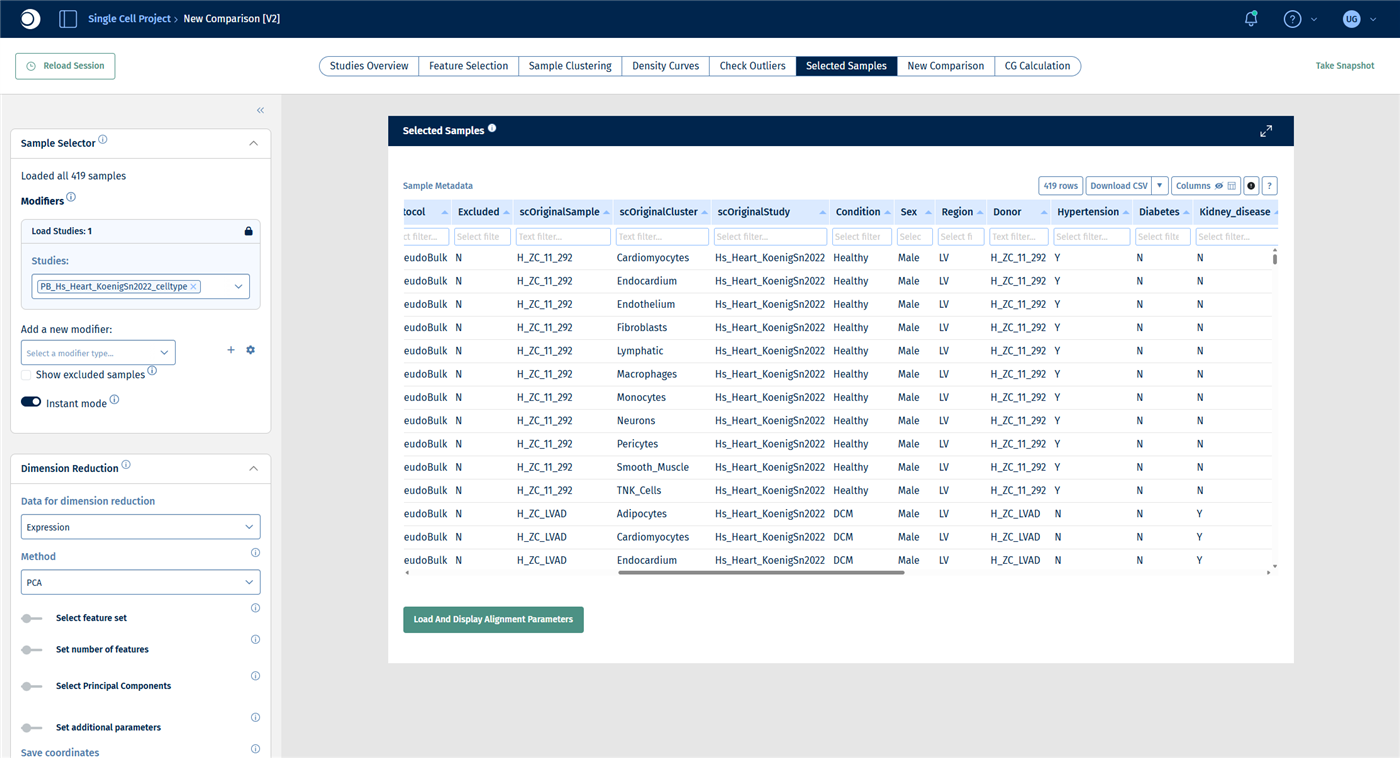
- Open the Selected Samples tab and look at the sample table.
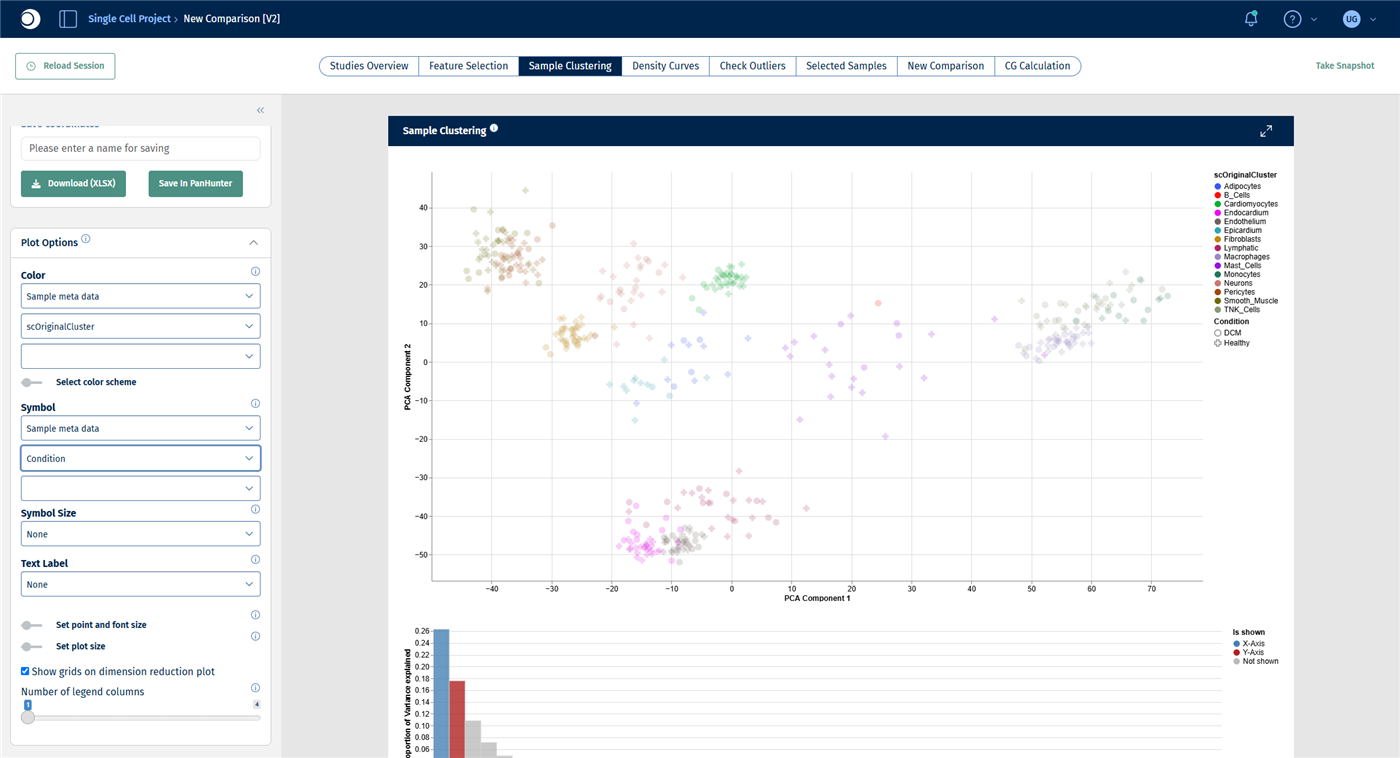
- Open the Sample Clustering tab. In Plot Options, set Color to Sample meta data and scOriginalCluster, and Symbol to Sample meta data and Condition.
Important: In the pseudobulk study, the cell type is stored in the column scOriginalCluster and the donor sample in scOriginalSample, not under the names used in scExplorer. All other metadata, such as Condition, Sex and Age, keep their names.
Check your result: samples
The study contains 419 samples: one pseudobulk profile for each combination of donor sample and cell type that had at least 20 cells.
Check your result: PCA
The profiles cluster by cell type. The differences between DCM and healthy samples are much smaller than the differences between cell types, which is why each cell type gets its own comparison in the next step.
Step 4: Compare DCM and healthy hearts in every cell type
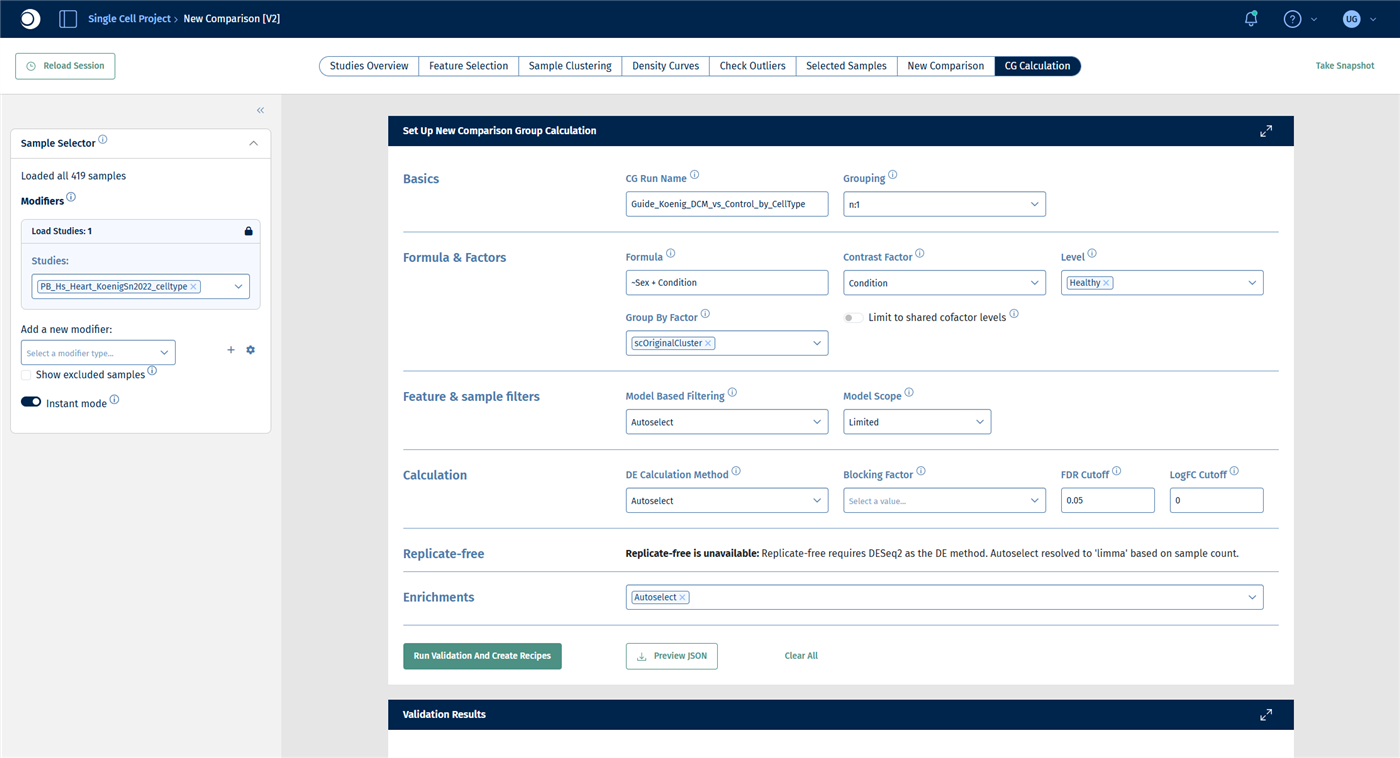
With a Group By Factor, a single comparison group calculation creates one comparison per level of that factor, here one per cell type. For a description of all fields, see New Comparison: CG Calculation.
- Open the CG Calculation tab.
- Under Basics, enter a CG Run Name, for example
Koenig_DCM_vs_Healthy_by_CellType, and keep Grouping at n:1. - Under Formula & Factors:
- enter the Formula
~Sex + Condition, so that the model accounts for differences between women and men. - set Contrast Factor to Condition and Level to Healthy. Healthy is the reference; DCM is compared against it.
- set Group By Factor to scOriginalCluster.
- enter the Formula
- Leave all other sections at their defaults.
- Click Run Validation And Create Recipes.
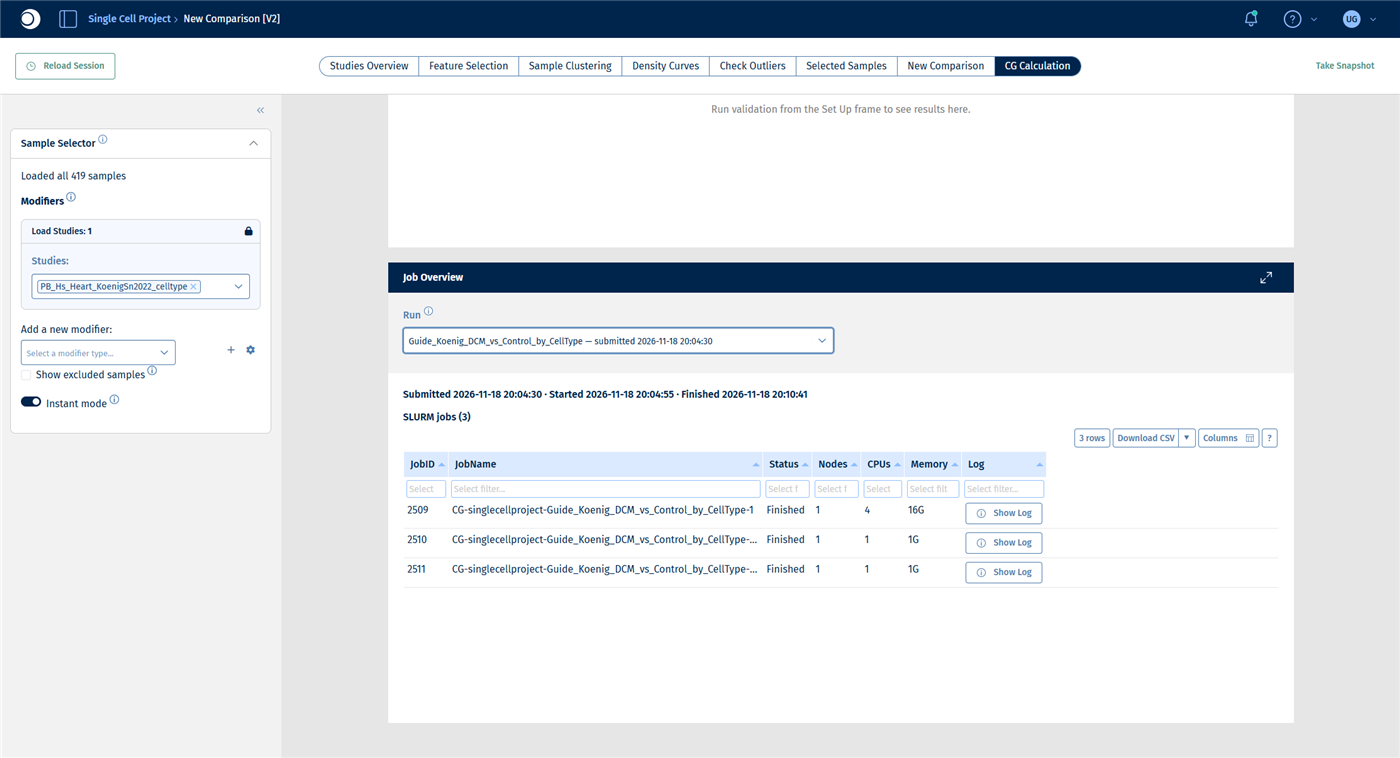
- Check the validation results, then click Submit Calculation To SLURM and follow the progress in the Job Overview.
Check your result: set-up
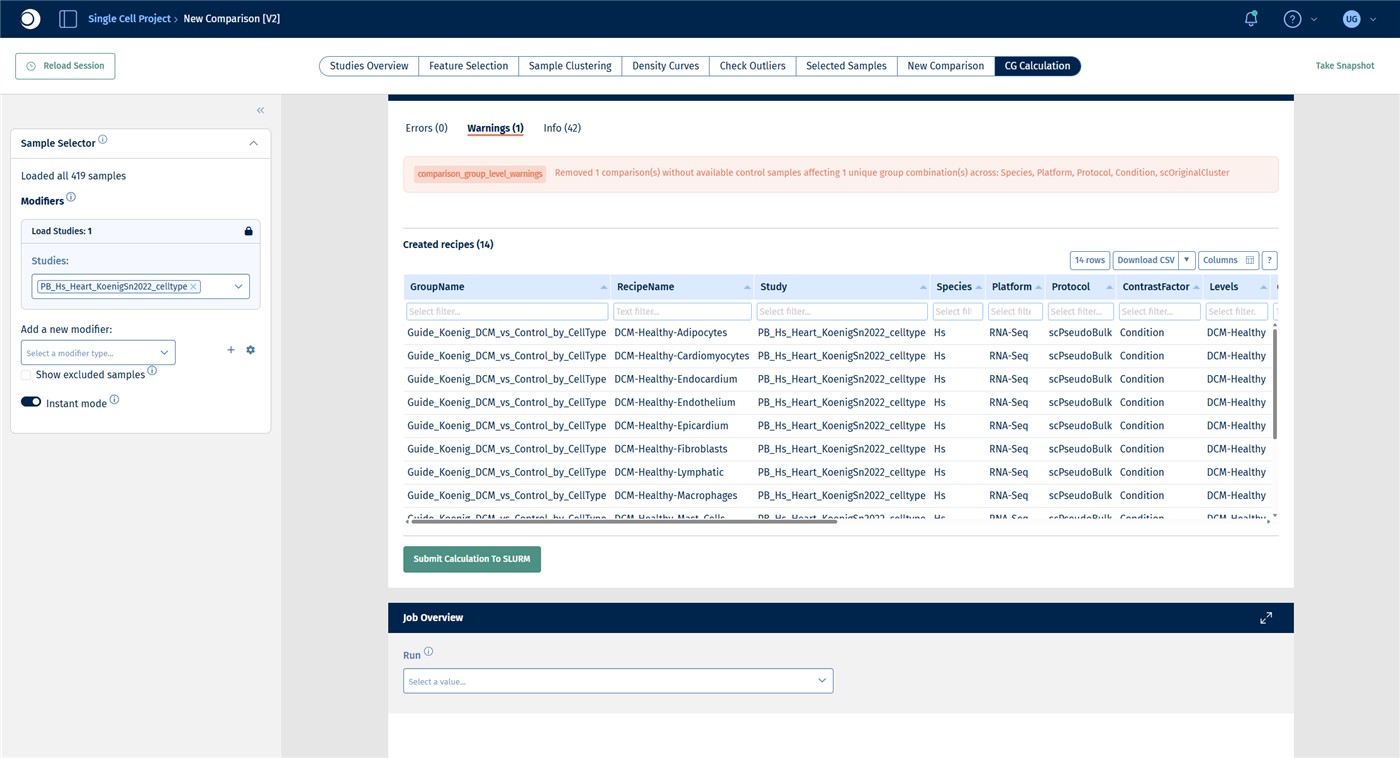
Check your result: validation
- Errors (0).
- Warnings (1): one comparison was removed because no control samples are available. This is the cell type B_Cells, which occurs only in DCM samples.
- Created recipes (14): one recipe DCM-Healthy-<cell type> per remaining cell type. The table shows the number of DCM and healthy samples per recipe. Cell types with only a few samples, such as Epicardium with 2 DCM samples, give less reliable results.
- The DE method is autoselected as deseq2.
Check your result: job overview
For this example the run takes about six minutes. The Job Overview does not refresh by itself: reload the page and select the run again to update the status.
Step 5: Find the cell types that respond
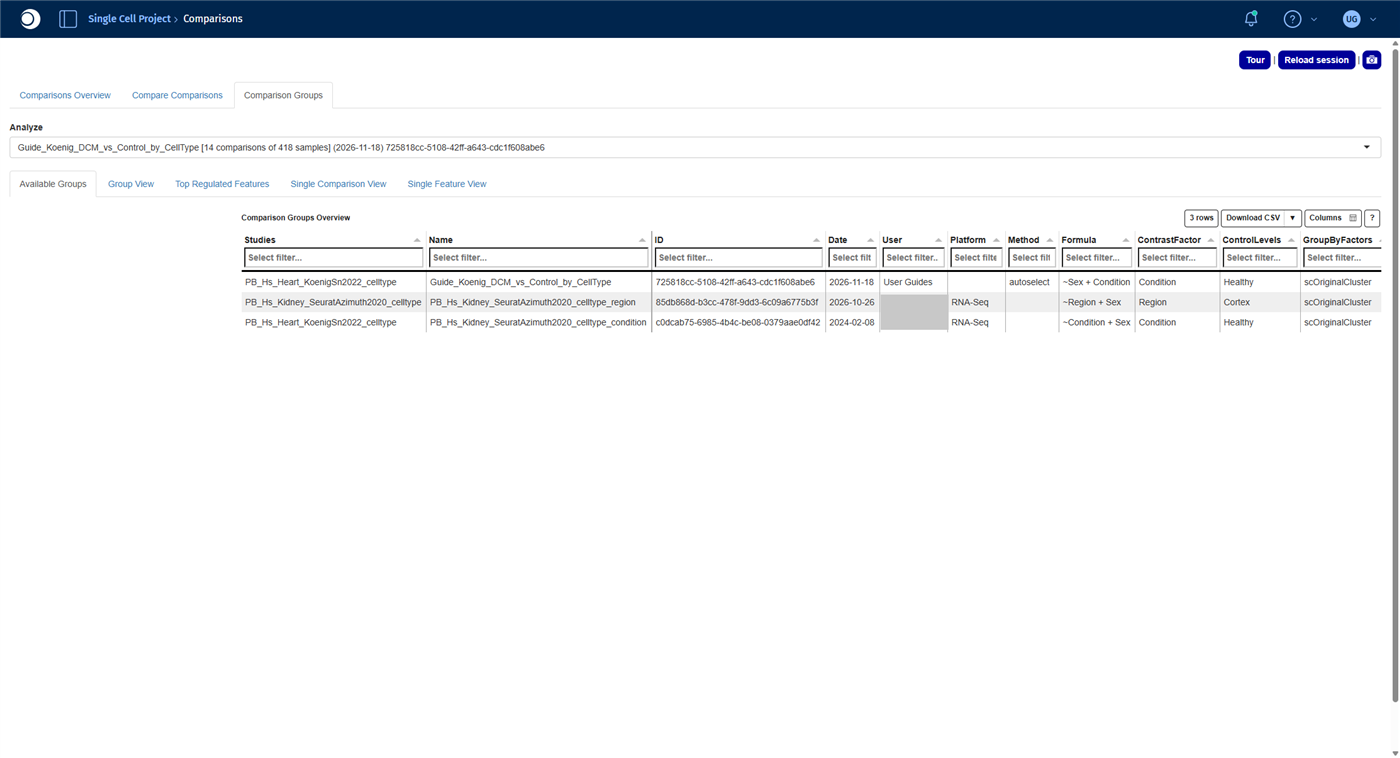
- Open the Comparisons app from the start page and open the Comparison Groups tab.
- In Analyze, select your run. It is listed with the number of comparisons and samples.
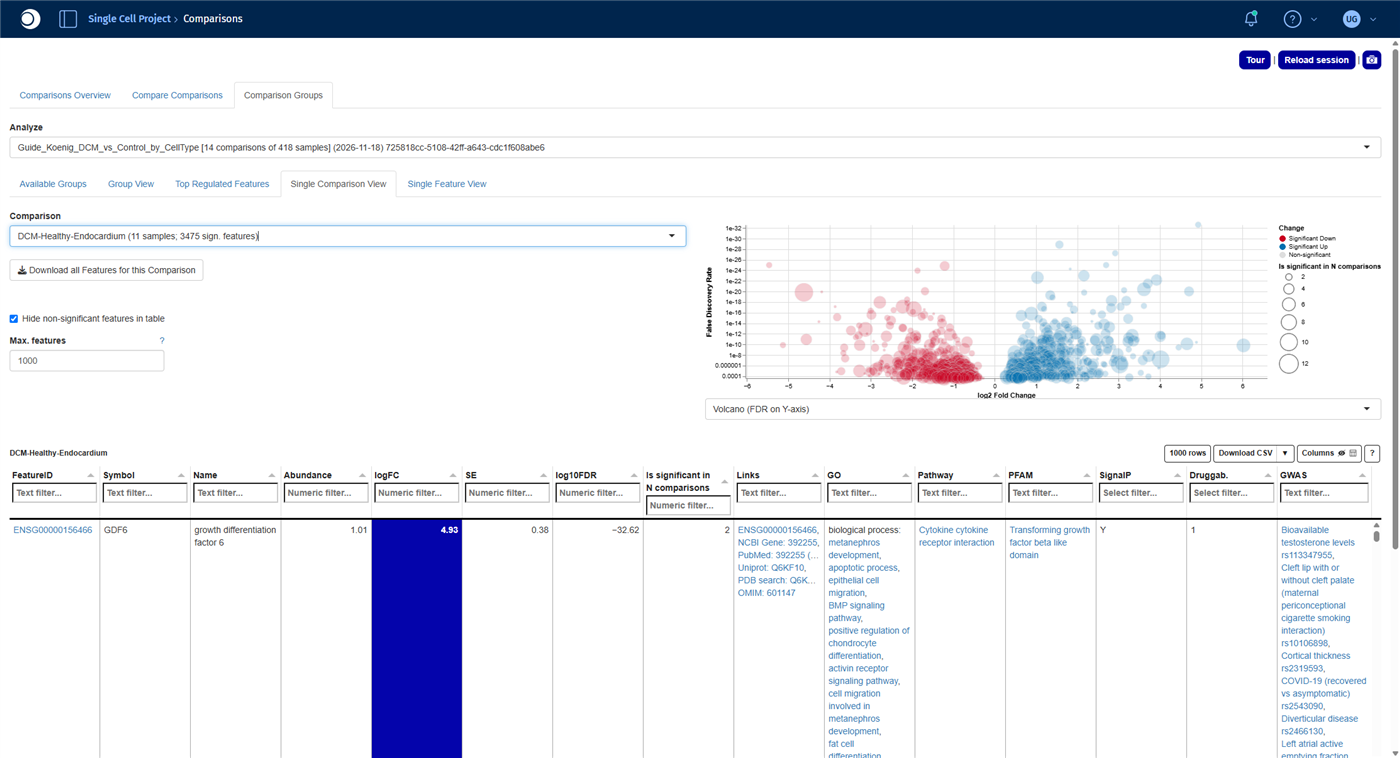
- Open the Single Comparison View tab. The Comparison list shows the number of significant features for each cell type. Select DCM-Healthy-Endocardium.
For all functions of the app, see Comparisons.
Check your result: comparison group
Check your result: significant features per cell type
The number of significant features differs a lot between cell types:
| Cell type | Significant features |
|---|---|
| Fibroblasts | 5313 |
| Cardiomyocytes | 5013 |
| Endothelium | 3632 |
| Endocardium | 3475 |
| Macrophages | 3423 |
| Pericytes | 2766 |
| Smooth_Muscle | 484 |
| Neurons | 248 |
| TNK_Cells | 110 |
| Epicardium | 109 |
| Lymphatic | 78 |
| Adipocytes | 47 |
| Mast_Cells | 8 |
| Monocytes | 0 |
Fibroblasts, cardiomyocytes and the cells lining the vessels and heart chambers (endothelium, endocardium) respond most strongly to the disease. Part of the differences also reflects sample size: small populations have fewer profiles and therefore less statistical power.
Check your result: endocardium
The comparison reads DCM-Healthy-Endocardium (11 samples; 3475 sign. features). The gene with the lowest FDR is GDF6, upregulated in DCM.
Step 6: Compare pathways across all cell types
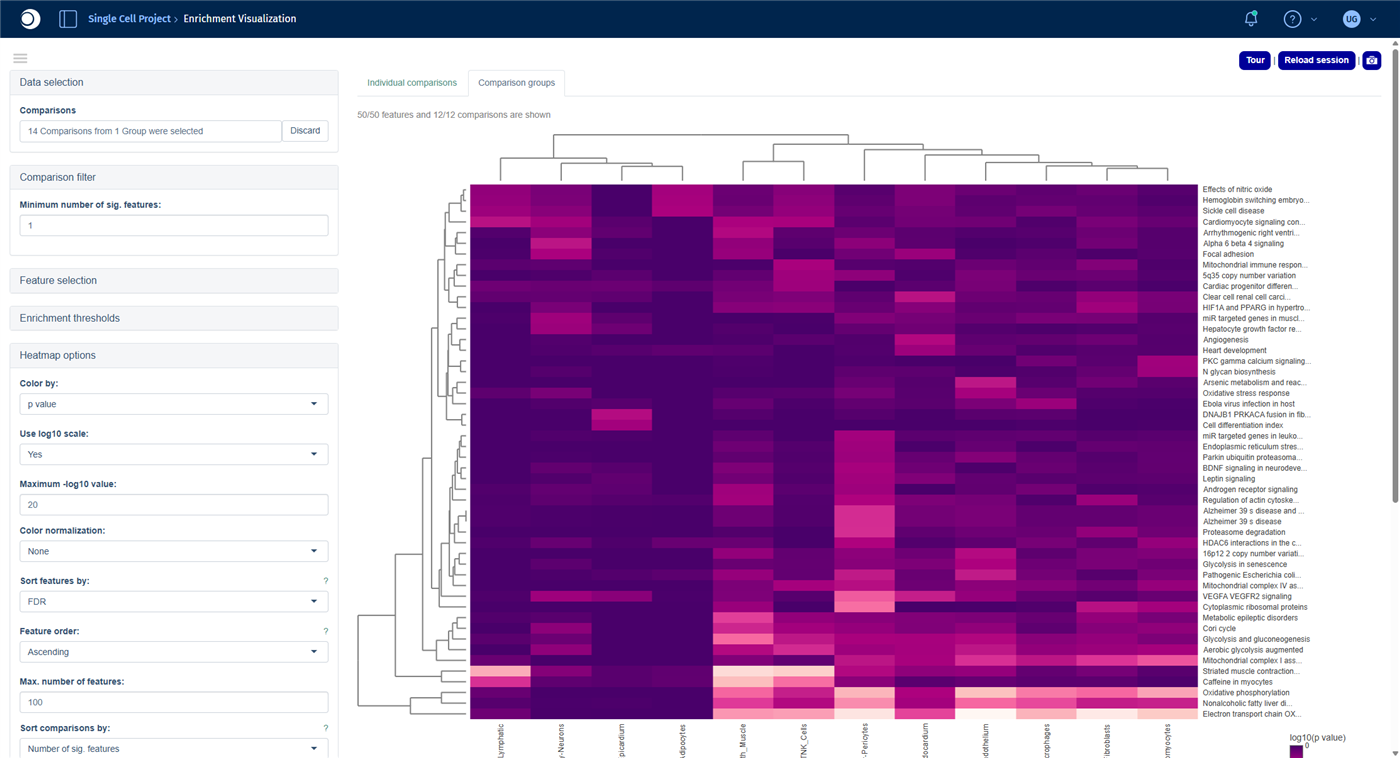
The Comparison groups tab of the Enrichment Visualization app shows the enrichment results of many comparisons side by side in one heatmap.
- Open the Enrichment Visualization app from the start page and open the Comparison groups tab.
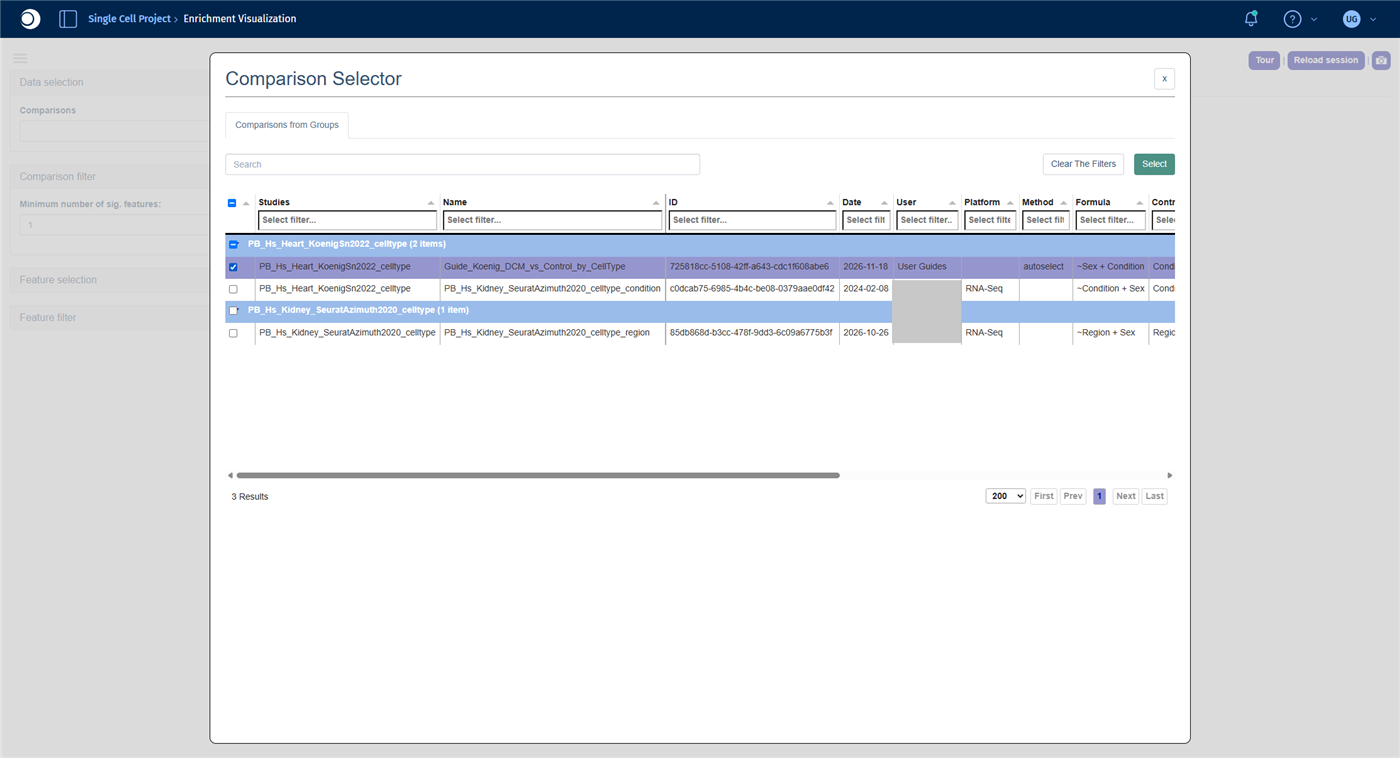
- Under Data selection, click into the Comparisons field. In the Comparison Selector, check your run and click Select. In the next view, check the box in the header row to select all comparisons and click Select again.
- Open Feature selection, set Heatmap Y-axis levels to Feature list collections and select the collection Wikipathways. The analysis method switches to Fisher.
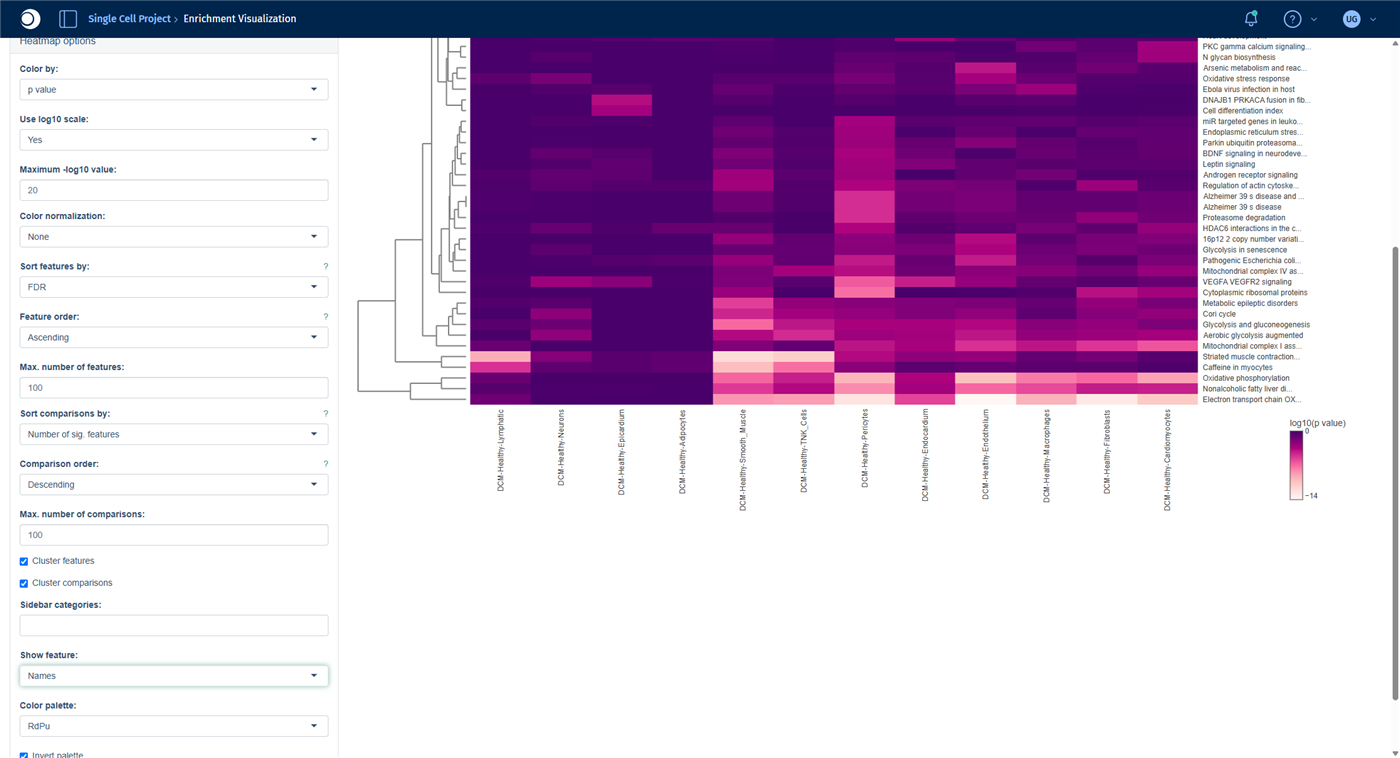
- Open Heatmap options and set Show feature to Names, so that the rows show pathway names instead of IDs.
Comparisons with too few significant features, here Monocytes and Mast_Cells, are left out.
Check your result: Comparison Selector
Check your result: heatmap
The heatmap shows the 50 most significant pathways (rows) across the cell types (columns); the darker the color, the lower the p-value. Both axes are clustered, so cell types with similar pathway changes are placed next to each other.
- The strongest signals are energy metabolism pathways such as Electron transport chain (OXPHOS), Oxidative phosphorylation and Glycolysis and gluconeogenesis, mainly in endothelium, fibroblasts and pericytes.
- Angiogenesis (WP1539) is enriched almost only in the endocardium. VEGFA VEGFR2 signaling is enriched in the endocardium and in pericytes.
Hover over a cell of the heatmap to see the full pathway name and the p-value; long names are cut off on the axis. Angiogenesis in the endocardium is the starting point for the next step.
Check your result: heatmap options
Step 7: Look at a pathway in one cell type
- Open the Pathway Mapping app from the start page.
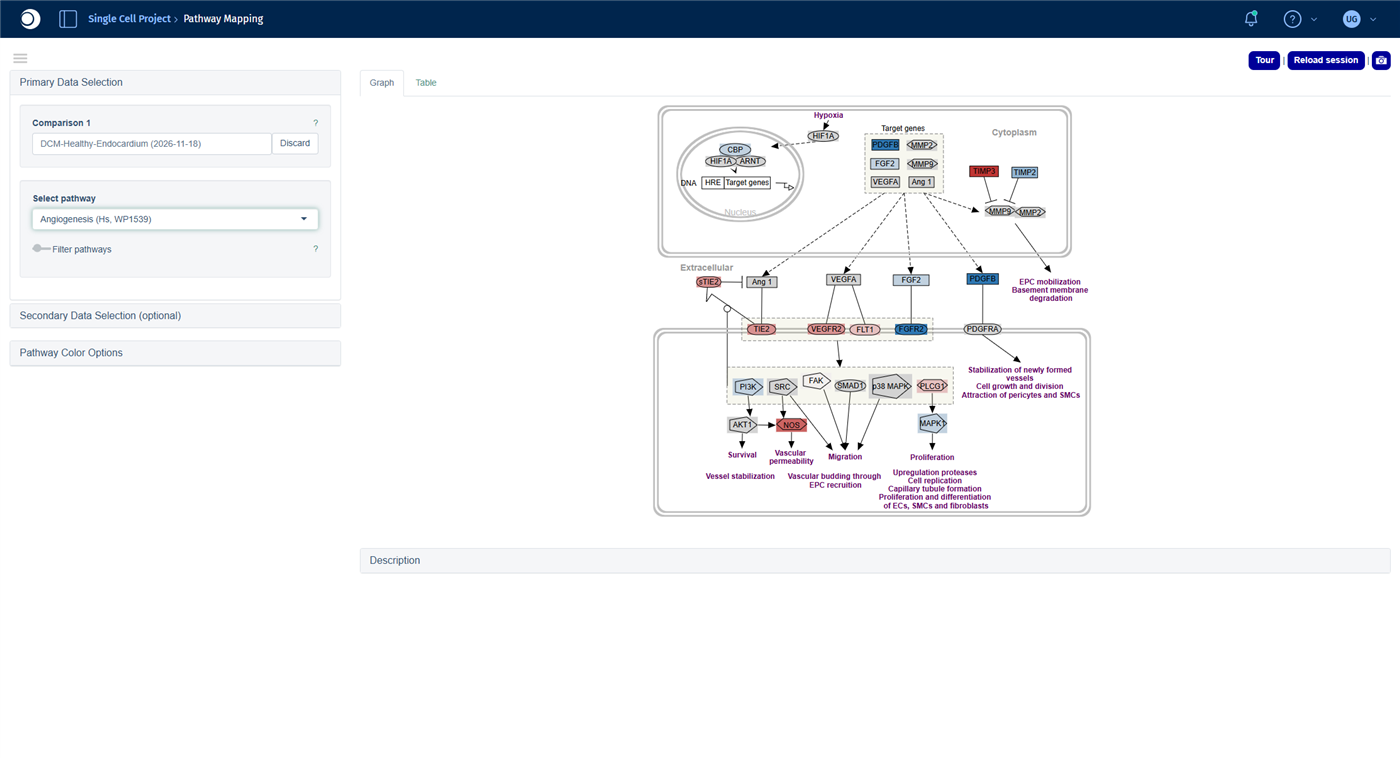
- Click into Comparison 1. In the Comparison Selector, open Comparisons from Groups, check your run and click Select. Type
Endocardiuminto the filter of the Name column, press Enter, check the comparison and click Select. - In Select pathway, type
Angiogenesisand select Angiogenesis (Hs, WP1539).
For coloring options and the table view, see Pathway Visualization.
Check your result
Blue genes are upregulated, red genes downregulated in the endocardium of DCM hearts. The growth factor PDGFB and the receptor FGFR2 are up, while the receptors VEGFR2 and TIE2 and the nitric oxide synthase NOS are down: a pattern that points to disturbed formation and maintenance of blood vessels.
Troubleshooting
My pseudobulk study does not appear in the Sample Selector.
The creation runs in the background and can take a while for large studies. Reload the app after some minutes. If the study still does not appear, contact your PanHunter administrator.
The validation removes comparisons.
A comparison needs samples of both conditions. Cell types that occur in only one condition, or whose profiles were dropped because of the minimum number of cells, are removed with a warning. The remaining comparisons are calculated normally.
I cannot find the column CellTypes in New Comparison [v2].
In pseudobulk studies, the cell type is stored in the column scOriginalCluster and the donor sample in scOriginalSample.
Next steps
- Look at a single gene across all cell types in the Single Feature View tab of the Comparisons app.
- Explore the enrichment of a single cell type in detail with the guide From differential expression to pathway enrichment, step 5.