Find what drives the clustering of your samples
Before you calculate any comparison, it pays to understand how your samples relate to each other. This guide shows you how to answer three questions with the New Comparison [v2] and Enrichment Visualization apps:
- Which metadata, for example tissue, age or sex, explains how the samples group?
- Which genes drive this grouping, and which biology do they represent?
- Are there samples that do not fit, and what is wrong with them?
You will:
- load a study and look at a PCA of all samples,
- let the Exploratory Analysis rank metadata and genes by how well they explain the PCA,
- find an outlier sample and check why it is an outlier,
- repeat the analysis for a single tissue and
- run an over-representation analysis on the genes that drive the grouping.
The guide takes about 30 minutes, most of it waiting for calculations. You do not need to calculate a comparison.
Before you start
- Access: You need access to a PanHunter project with the apps New Comparison [v2] and Enrichment Visualization.
- Example data: The guide uses the study Yu2014, a public rat body map (GSE53960) with eleven tissues from rats aged 2, 6, 21 and 104 weeks, both sexes. If your project does not contain Yu2014, follow the same steps with your own study.
- Background: The methods behind the steps are explained in Dimensionality reduction, Exploratory analysis and Enrichment analysis.
Step 1: Load the study
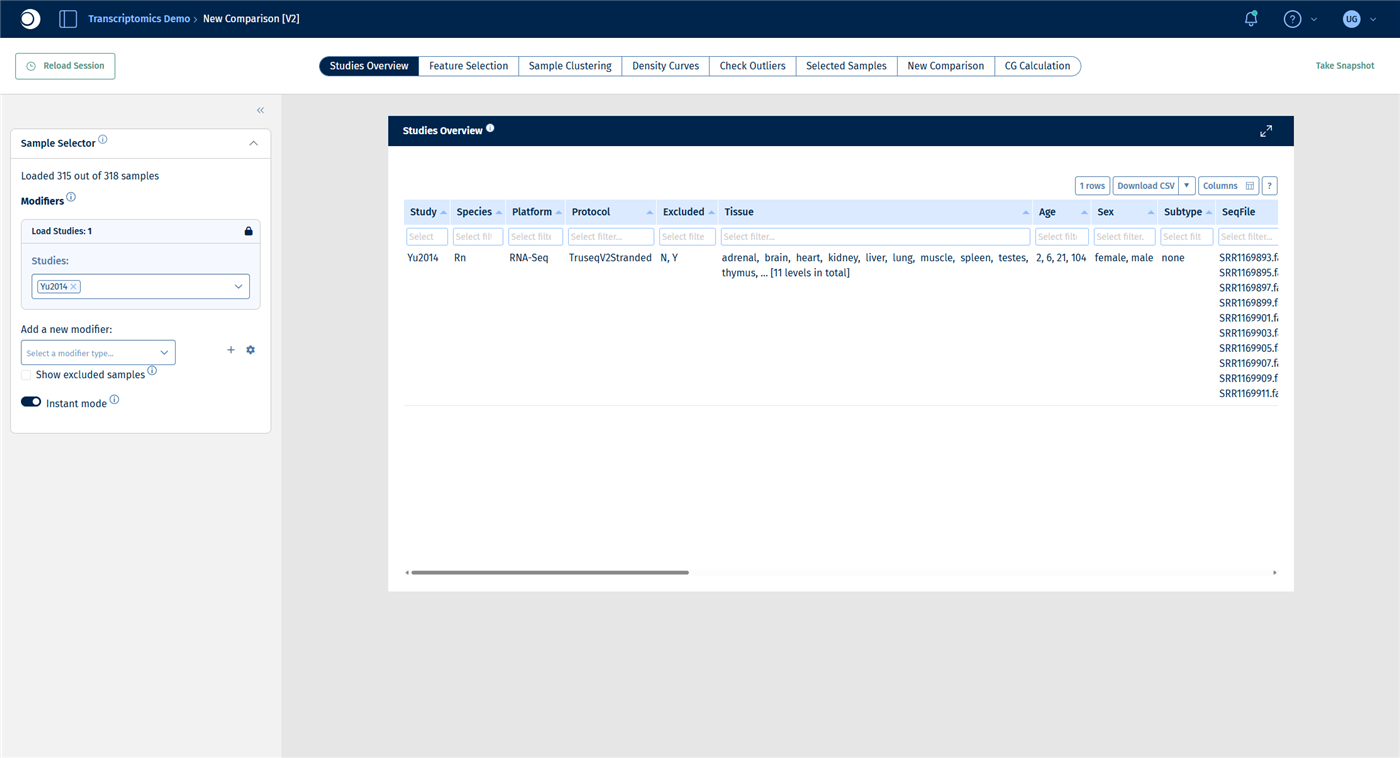
Open the New Comparison [v2] app from the start page of your project. The Sample Selector panel on the left defines which samples all tabs of the app work with.
- In Studies, start typing
Yu20and select Yu2014. - Do not add any filter yet: this time you want to see all samples.
Check your result
The Sample Selector reads Loaded 315 out of 318 samples. Three samples are excluded by default because they failed quality control. The Studies Overview tab lists the eleven tissues, the four age groups and both sexes.
Step 2: Look at the PCA of all samples
- Open the Sample Clustering tab. It shows a PCA of the selected samples, with the explained variance per principal component in the bar chart below.
- In the left sidebar, open Plot Options.
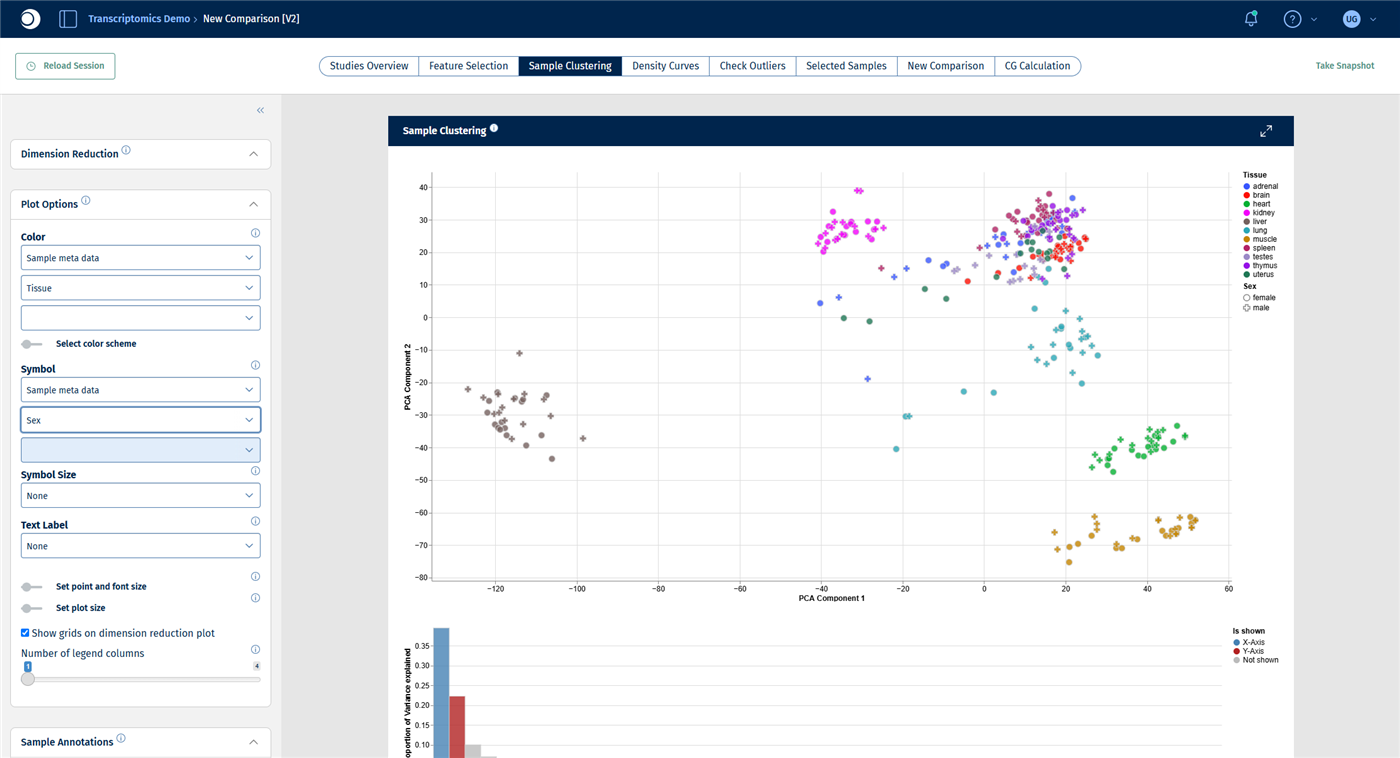
- Set Color to Sample meta data and select Tissue. Set Symbol to Sample meta data and select Sex.
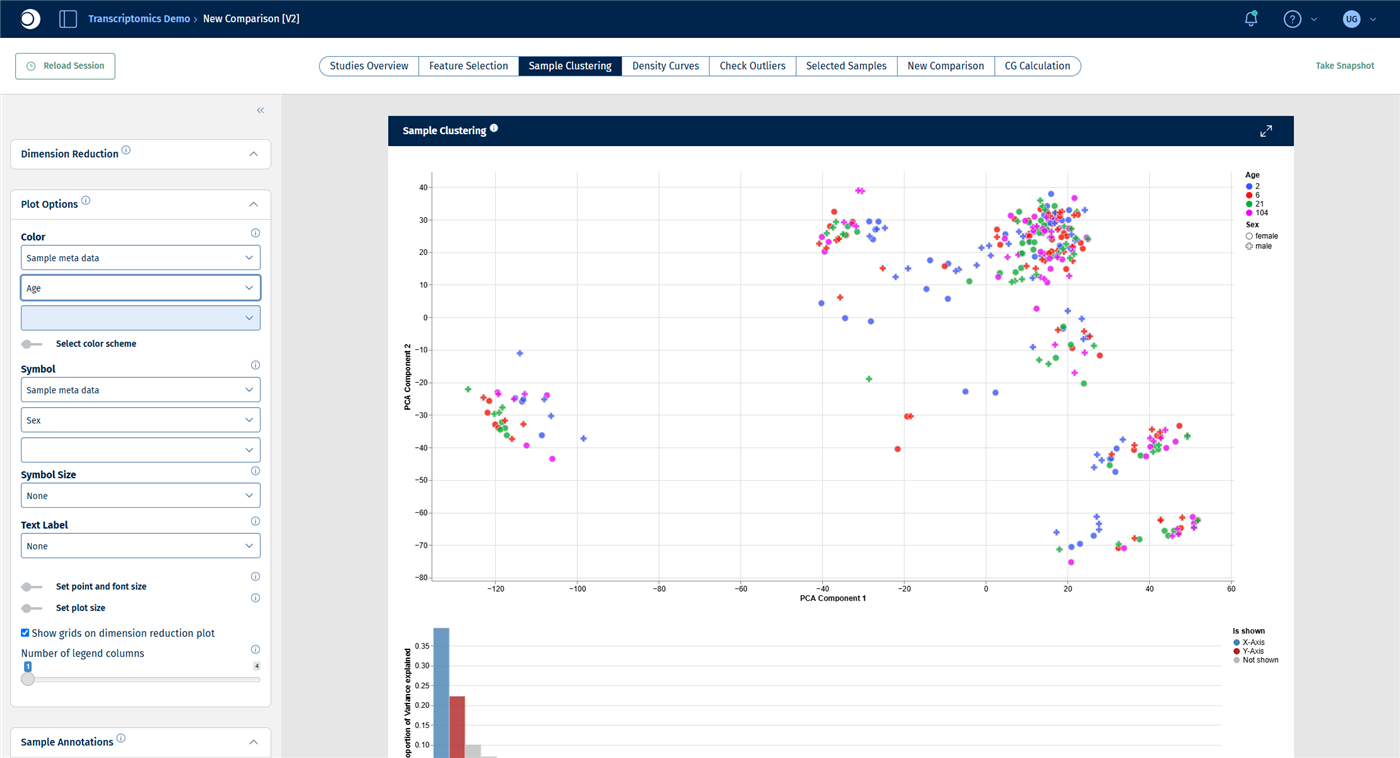
- Switch the color column to Age.
For all display options, see Plot Options panel.
Check your result: PCA colored by tissue
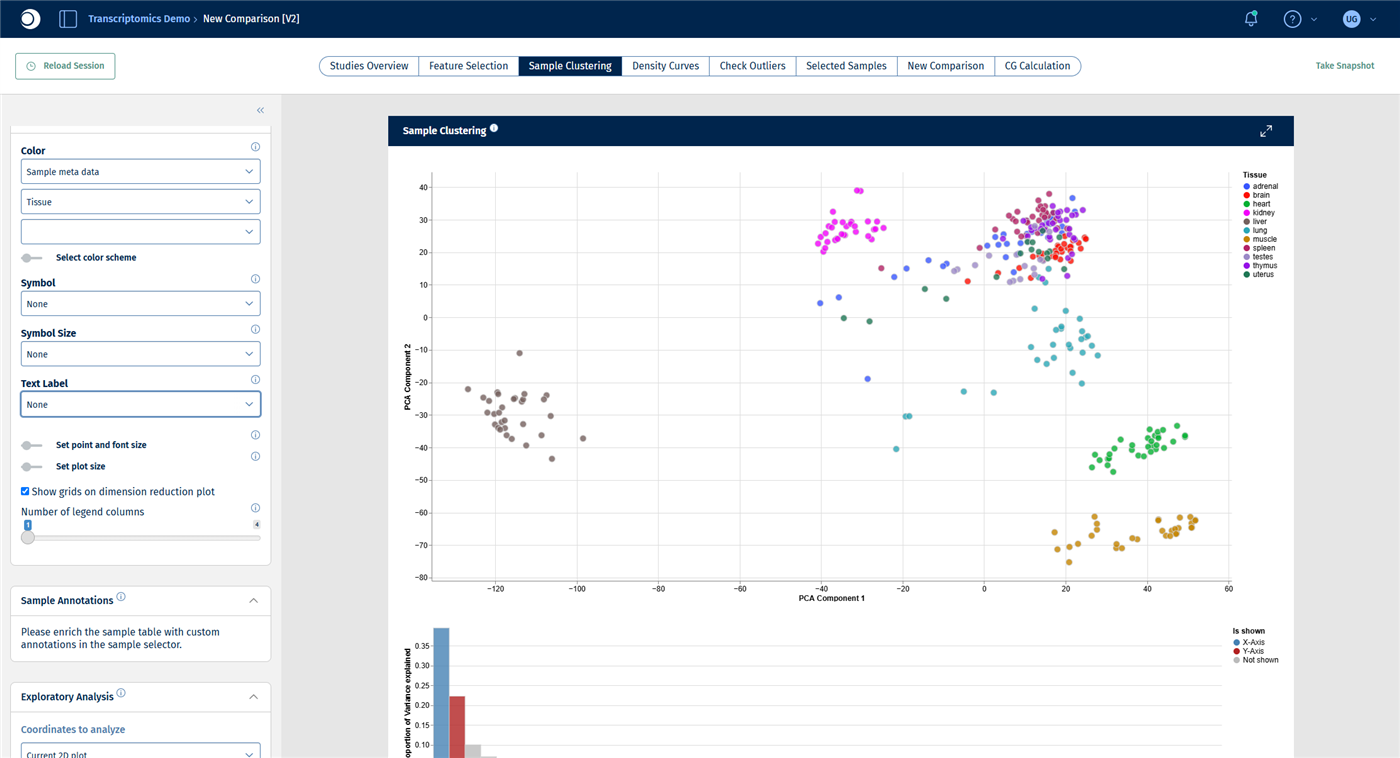
Most tissues form their own cluster. Liver lies far to the left, kidney, lung, heart and muscle are clearly separated, while brain, spleen, thymus, testes, uterus and adrenal gland overlap more. The first two principal components explain about 39 % and 22 % of the variance.
Check your result: PCA colored by age
The age groups are mixed within every tissue cluster. Across all tissues, age has no visible effect on the first two principal components.
Looking at colors works well for a few metadata columns. The next step does the same systematically for all columns and all genes.
Step 3: Rank metadata and genes with the Exploratory Analysis
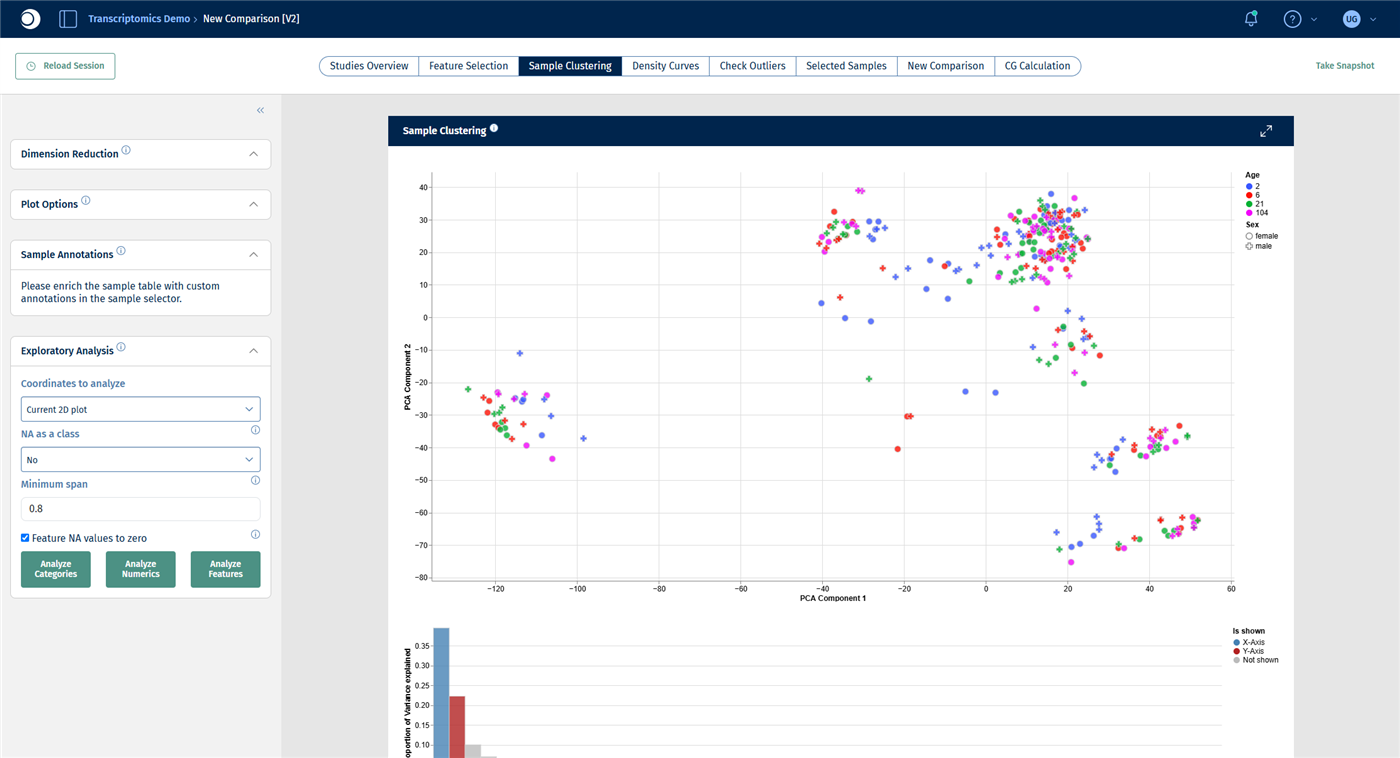
The Exploratory Analysis panel tests which metadata columns and which features (here: genes) are associated with the current plot. For a detailed description of all settings, see Exploratory analysis panel.
- In the left sidebar, collapse Dimension Reduction and Plot Options by clicking their headers, so that the Exploratory Analysis panel becomes visible.
- Keep Coordinates to analyze at Current 2D plot and the other settings at their defaults.
- Click Analyze Categories. After a few seconds, the result appears as a table below the bar chart.
- Click Analyze Features. The table now lists genes.
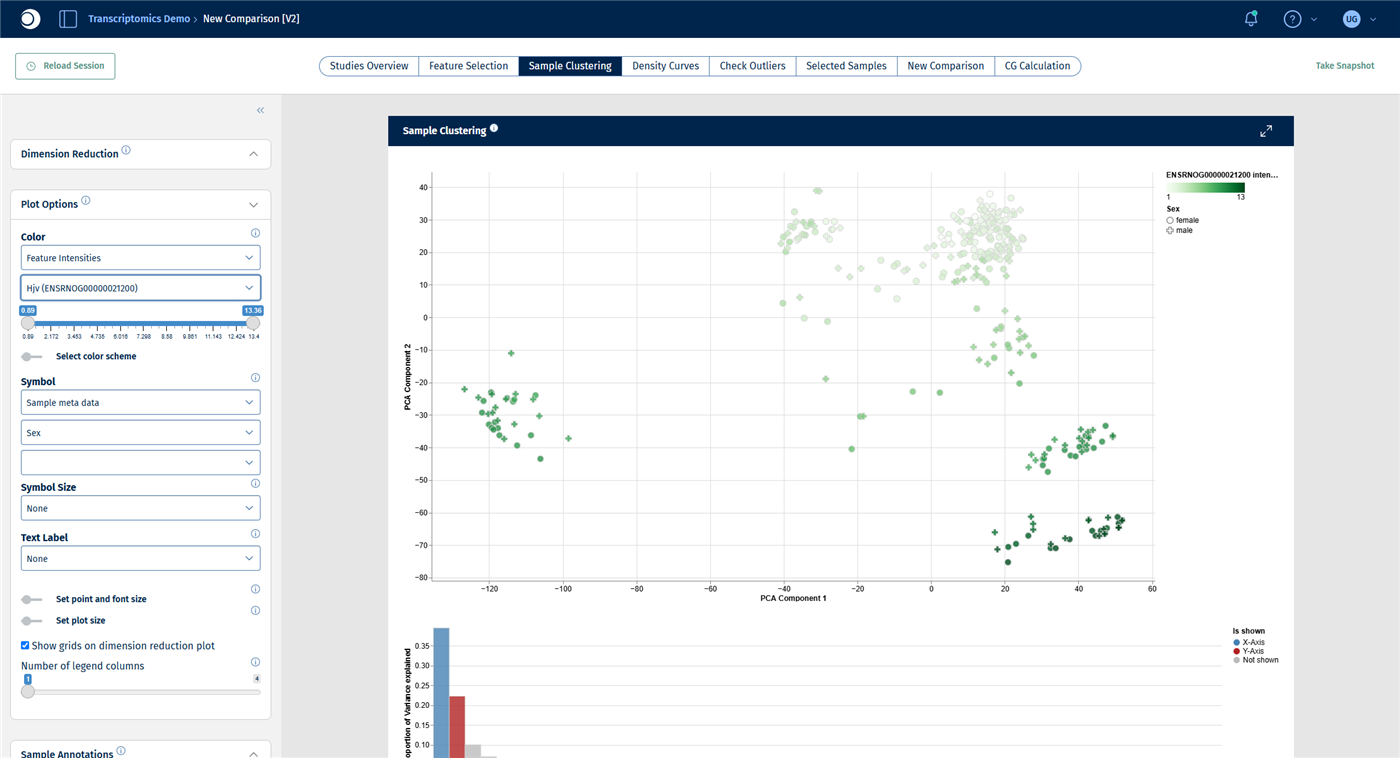
- In Plot Options, set Color to Feature Intensities and type the symbol of the top gene, here
Hjv, into the feature field.
Check your result: settings
Check your result: categories
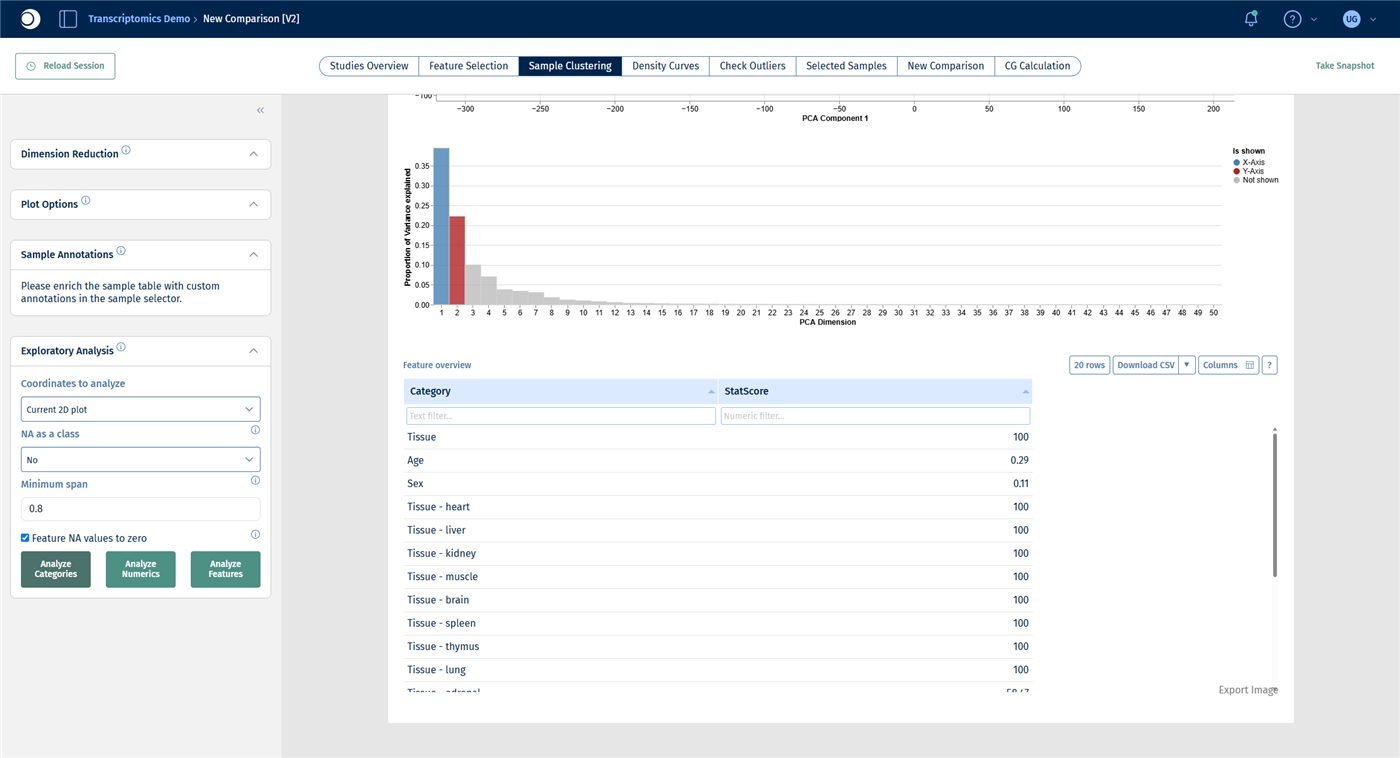
The table lists each metadata column and each of its levels with a StatScore: the higher the score, the better the column or level explains the position of the samples in the plot. Tissue reaches the maximum score of 100, while Age (0.29) and Sex (0.11) hardly explain anything. This confirms what you saw in step 2.
Check your result: features
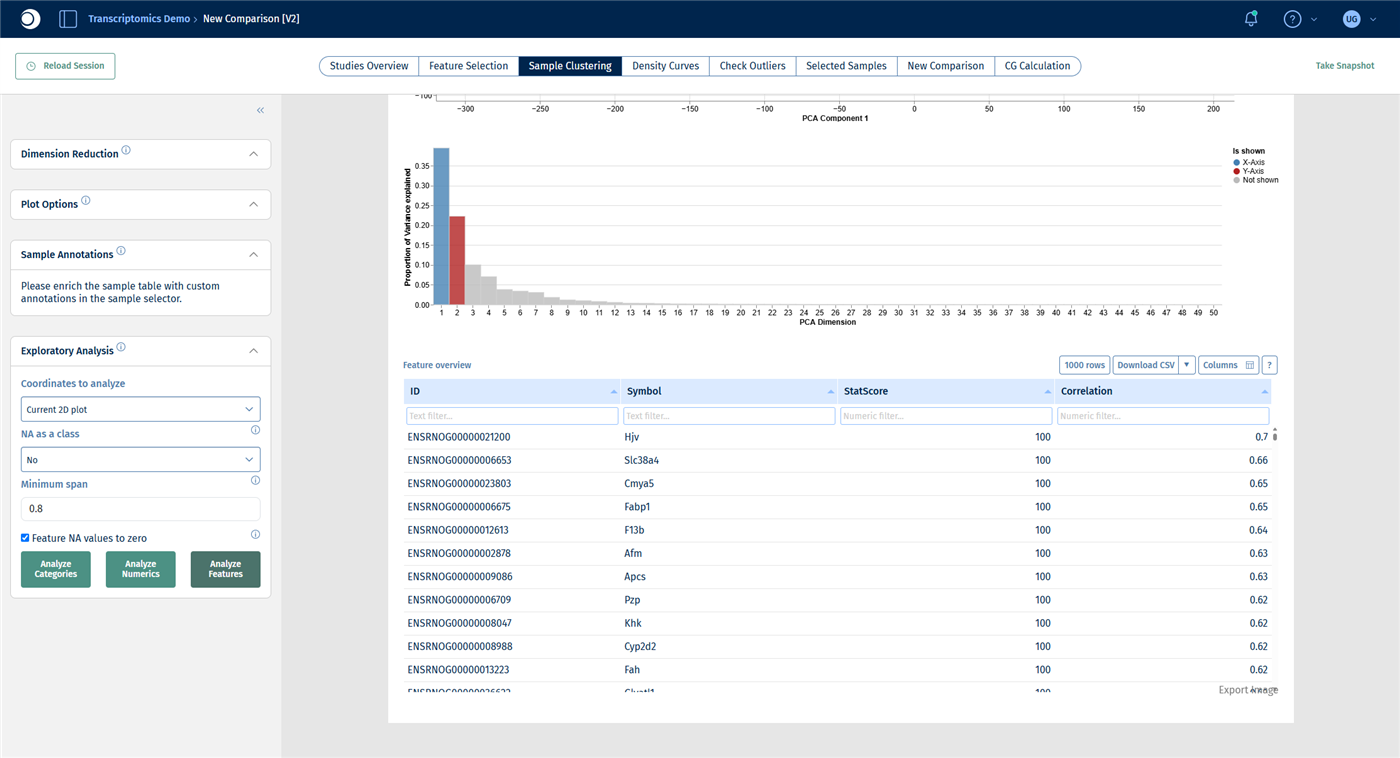
The genes are sorted by their Correlation with the plot coordinates. The top genes, such as Hjv, Slc38a4, Fabp1 and F13b, are mostly liver genes. They explain why the liver samples are so far away from all other tissues. Colored by Hjv, the liver cluster is clearly darker than the rest.
Note: Analyze Numerics answers No numeric variables found in sample table. for this study. Although age is a number, Yu2014 stores it as four groups (2, 6, 21 and 104 weeks), that is, as a category. That is why age appears in the results of Analyze Categories, with one row per age group. In studies with a numeric column, for example age in years or a quality score, use Analyze Numerics to find out whether the column follows the plot.
Step 4: Find and inspect an outlier
Public data is not perfect, and neither is your own. A sample that sits apart from the other samples of its group can be a biological extreme, but also a technical problem such as contamination or a sample mix-up. Such samples can distort every analysis that follows, so check them before you calculate comparisons.
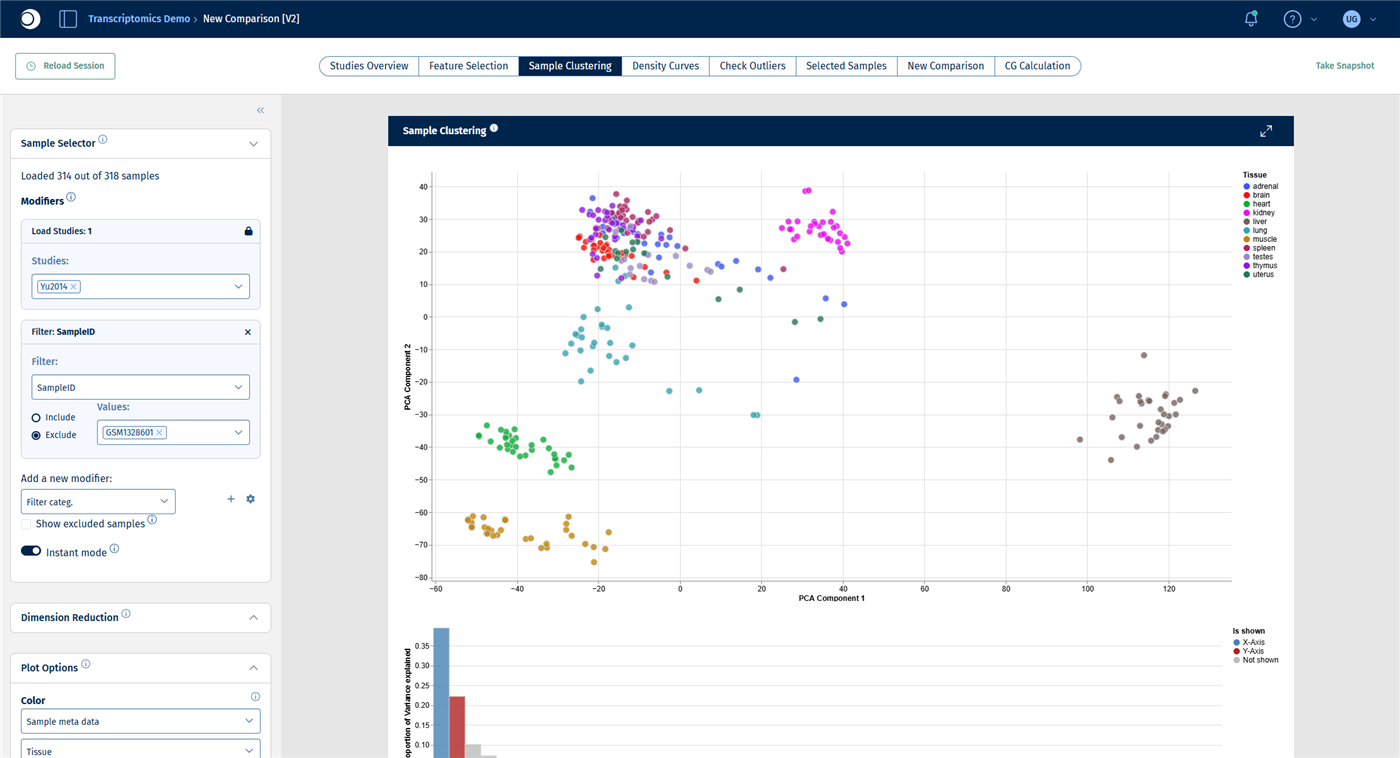
- Color the PCA by Tissue again. Look for samples that lie far away from the cluster of their own tissue. In Yu2014, a few lung samples lie well below the lung cluster.
- To find out which samples they are, set Text Label in Plot Options to Sample meta data and SampleID, or hover over a point. The most isolated lung sample is GSM1328601.
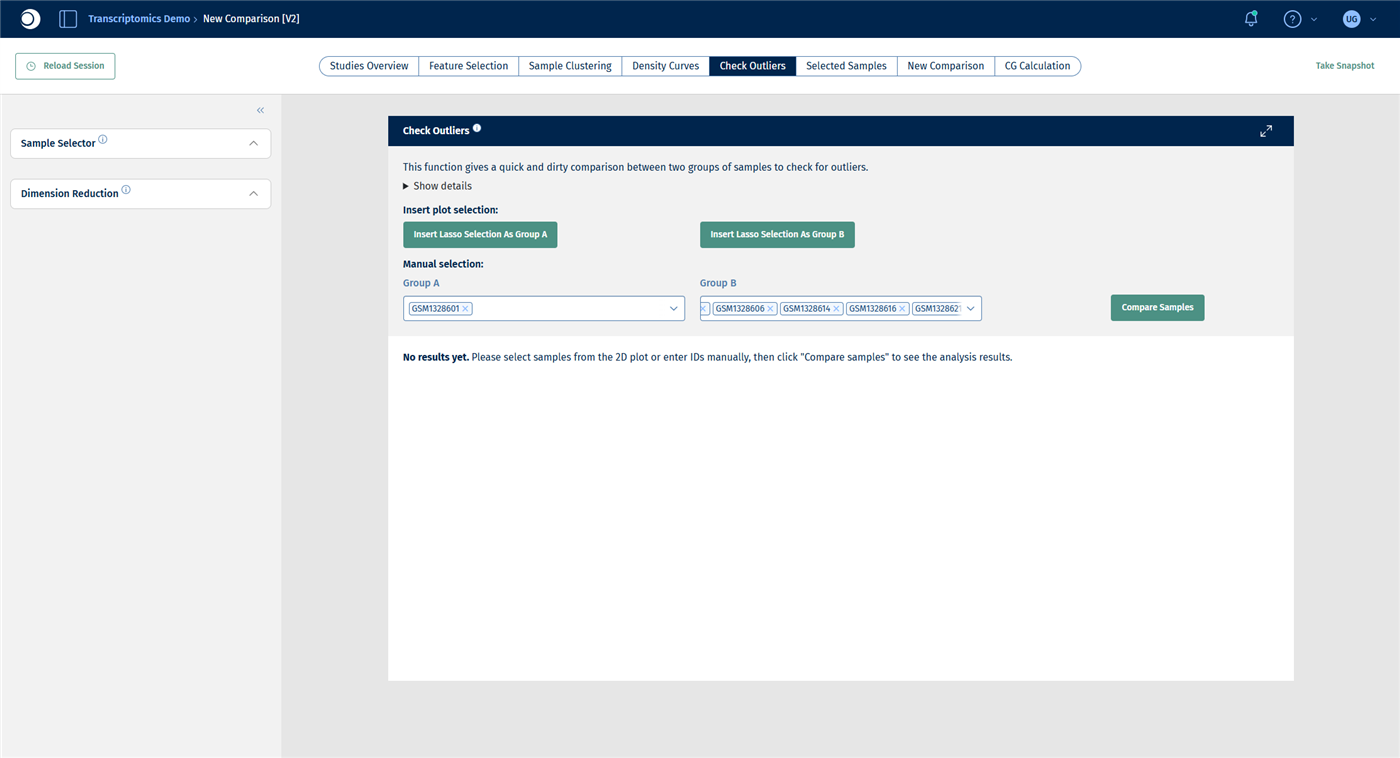
- Open the Check Outliers tab. Under Manual selection, type
GSM1328601into Group A and press Enter. Add some other lung samples to Group B, for example GSM1328604, GSM1328606, GSM1328614, GSM1328616, GSM1328621 and GSM1328627. - Click Compare Samples.
Instead of typing sample IDs, you can also select points in the plot with the lasso and click Insert Lasso Selection As Group A or B. For details, see New Comparison: Check Outliers.
Check your result: outlier in the PCA
Check your result: groups
Check your result: outlier table
The Custom outlier table lists the genes with the largest differences between the two groups. At the top are Ces2j, Akr1d1, Slco1b2, Serpina3c, Cyp1a2 and Cyp7a1: genes that are typically expressed in the liver, not in the lung. The “lung” sample GSM1328601 most likely contains liver tissue or was mixed up.
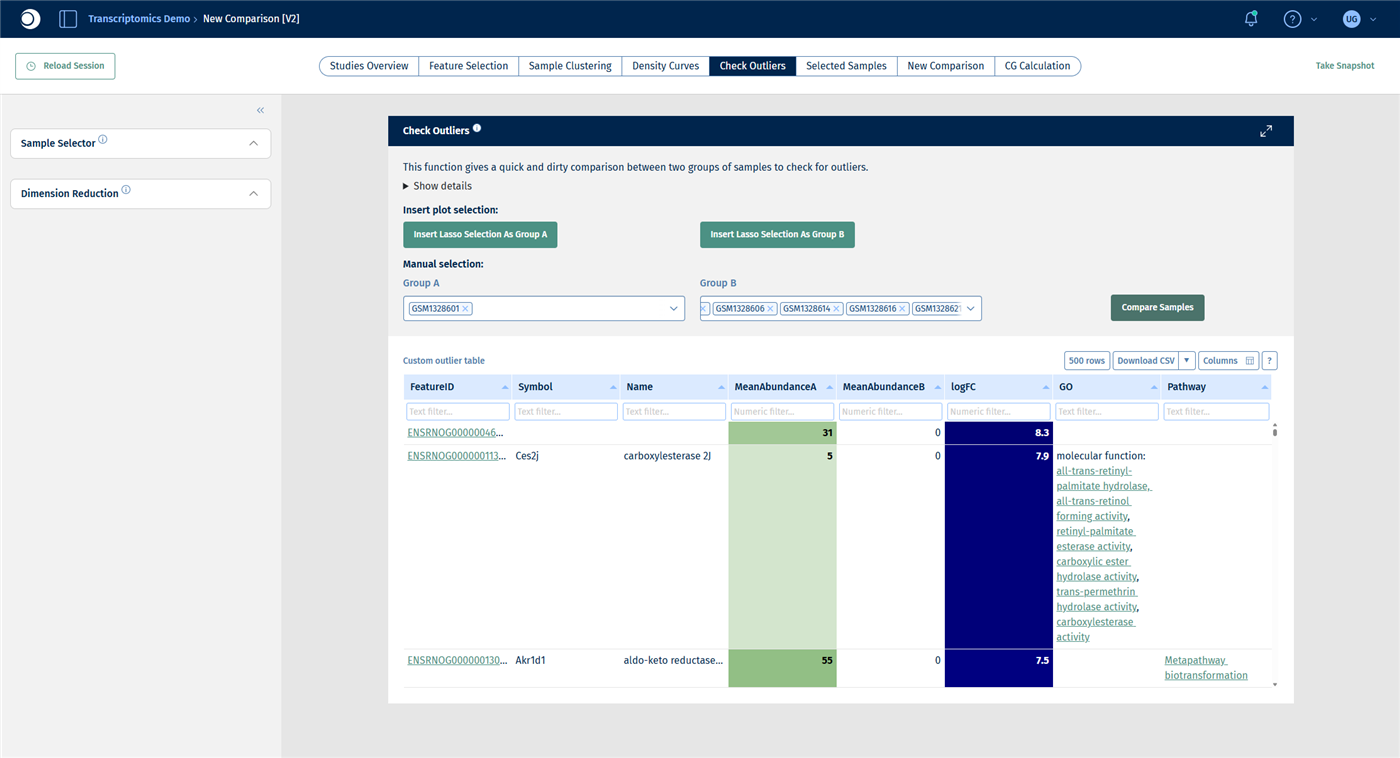
Important: Check Outliers is a quick comparison without any statistical test. Genes with very low counts can reach large fold changes by chance. Use it to understand an outlier, not to find differentially expressed genes.
Once you have decided that a sample should not be used, remove it from the selection:
- In the Sample Selector, add a Filter categ. modifier.
- Set Filter to SampleID, select Exclude and enter
GSM1328601in Values.
Check your result: sample excluded
The Sample Selector reads Loaded 314 out of 318 samples and the PCA is recalculated. Do not be surprised if the plot appears mirrored: the sign of a principal component is arbitrary. A few other lung samples still lie apart; check them the same way before you exclude them.
Step 5: Repeat the analysis for one tissue
Within a tissue, smaller effects such as age and sex become visible that are hidden by the large differences between tissues.
- Keep the SampleID filter from step 4; it does not affect the liver samples.
- Add a Filter categ. modifier with Filter set to Tissue, Include and Values set to liver.
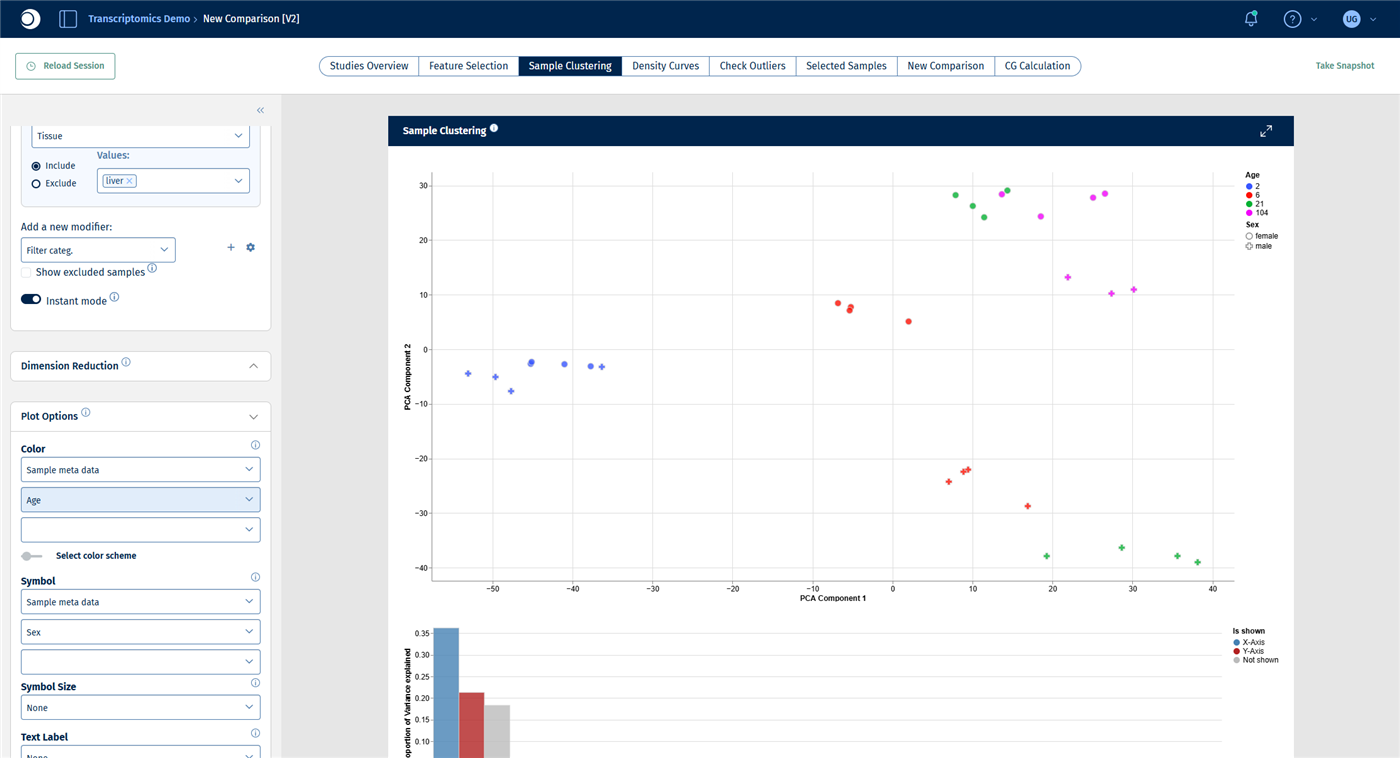
- In the Sample Clustering tab, set Color to Age and Symbol to Sex.
- In the Exploratory Analysis panel, click Analyze Categories and then Analyze Features.
Check your result: liver PCA
The selection contains 31 liver samples. The first principal component separates the samples by age, from 2-week-old rats on the left to 104-week-old rats on the right. The second principal component separates females from males.
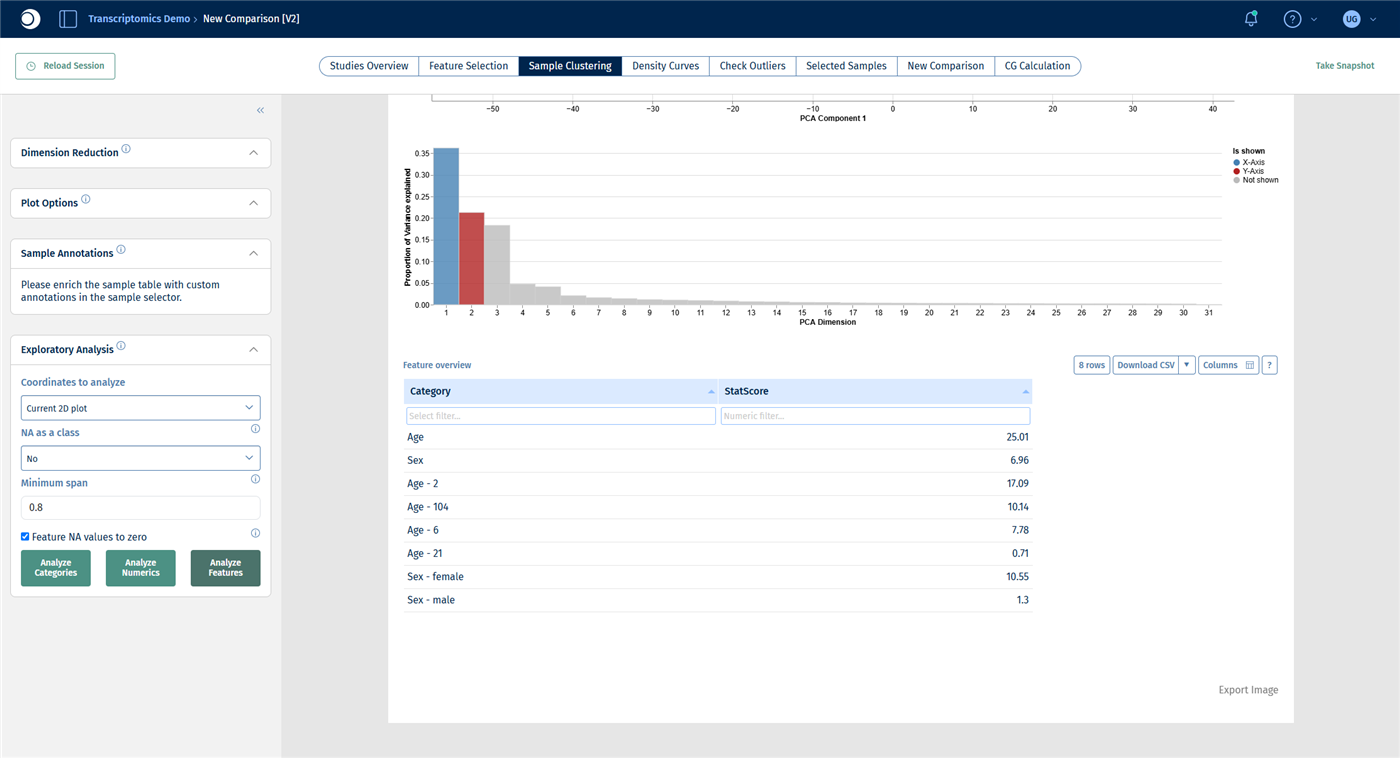
Check your result: categories
Now Age ranks first (StatScore about 25), followed by Sex (about 7).
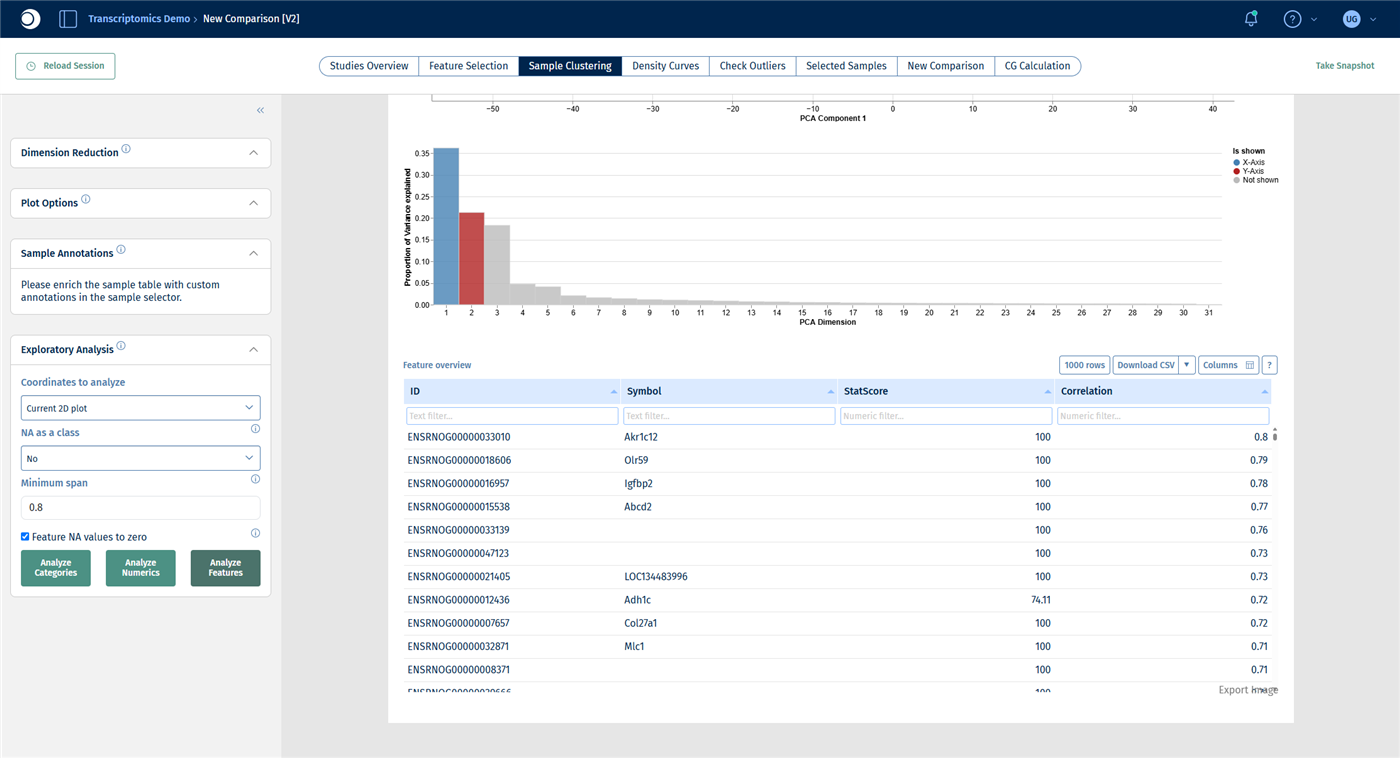
Check your result: features
The top genes include Akr1c12, Igfbp2, Abcd2 and Adh1c.
Step 6: Find the biology behind the driving genes
A list of top genes is hard to interpret on its own. An over-representation analysis tells you which pathways and processes are enriched among them. The Enrichment Visualization app accepts any gene list, not only the results of a comparison.
- Note the gene symbols of the top 50 genes from the feature table of step 5.
- Open the Enrichment Visualization app from the start page.
- Under Data selection, set the data source to Manual input, Species to Rn and Type to Genesymbol.
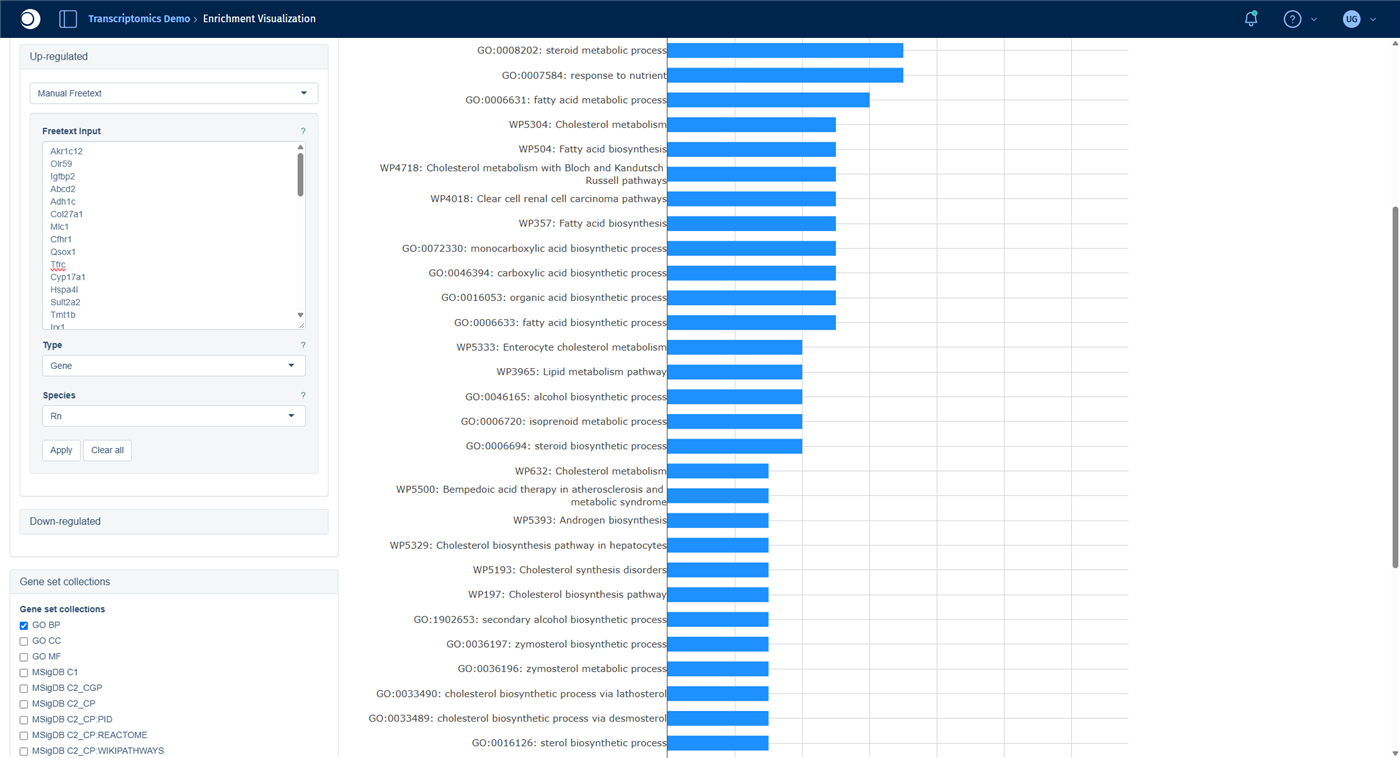
- Open the Up-regulated block by clicking its title, select Manual Freetext and paste the gene symbols, one per line. Set Type to Gene and Species to Rn, then click Apply.
- Under Gene set collections, check GO BP, Wikipathways (Hs) and Wikipathways (Rn).
- Click Perform Enrichment Analysis. The calculation takes a few minutes.
Note: The species must be set twice: once for the whole input and once for the gene list itself.
The results are shown in the same tabs as for a comparison; see Enrichment Visualization and step 5 of the guide From differential expression to pathway enrichment.
Check your result: gene list
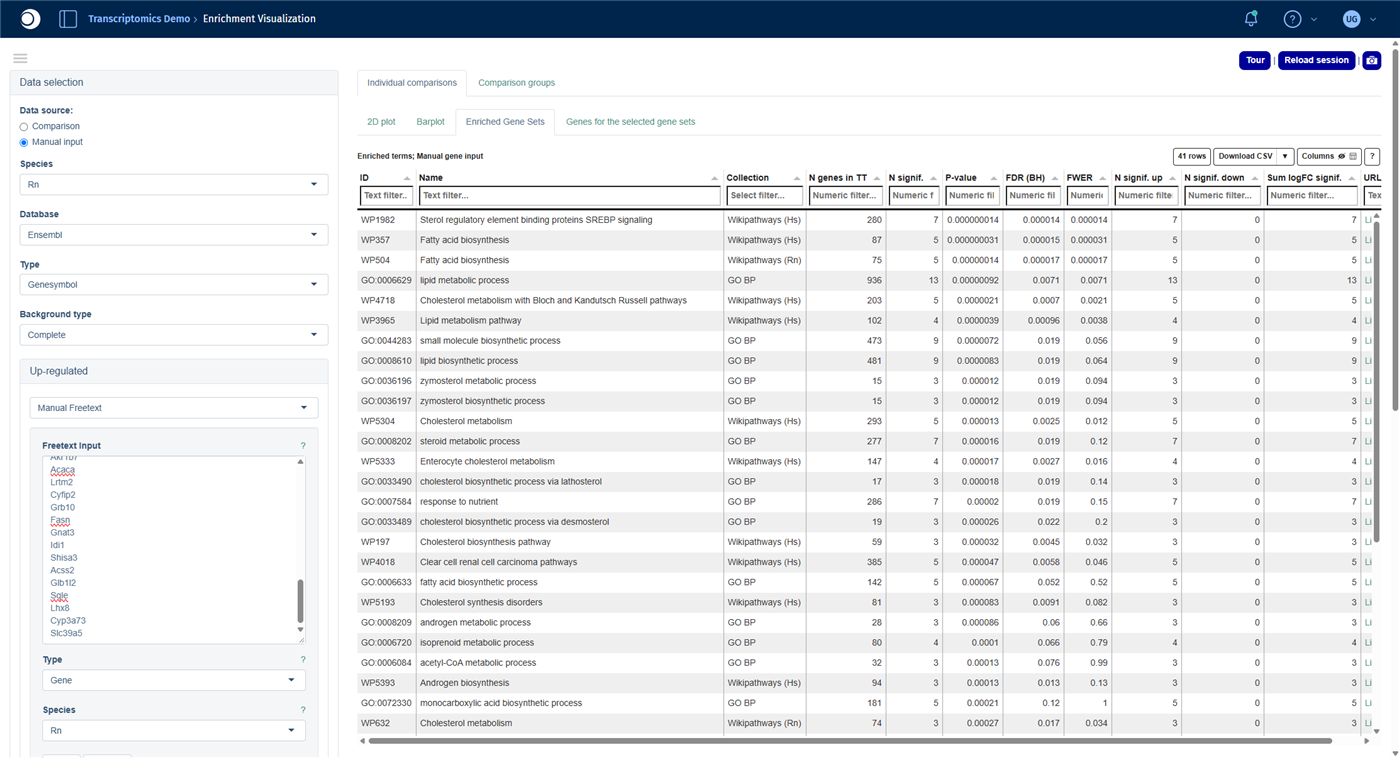
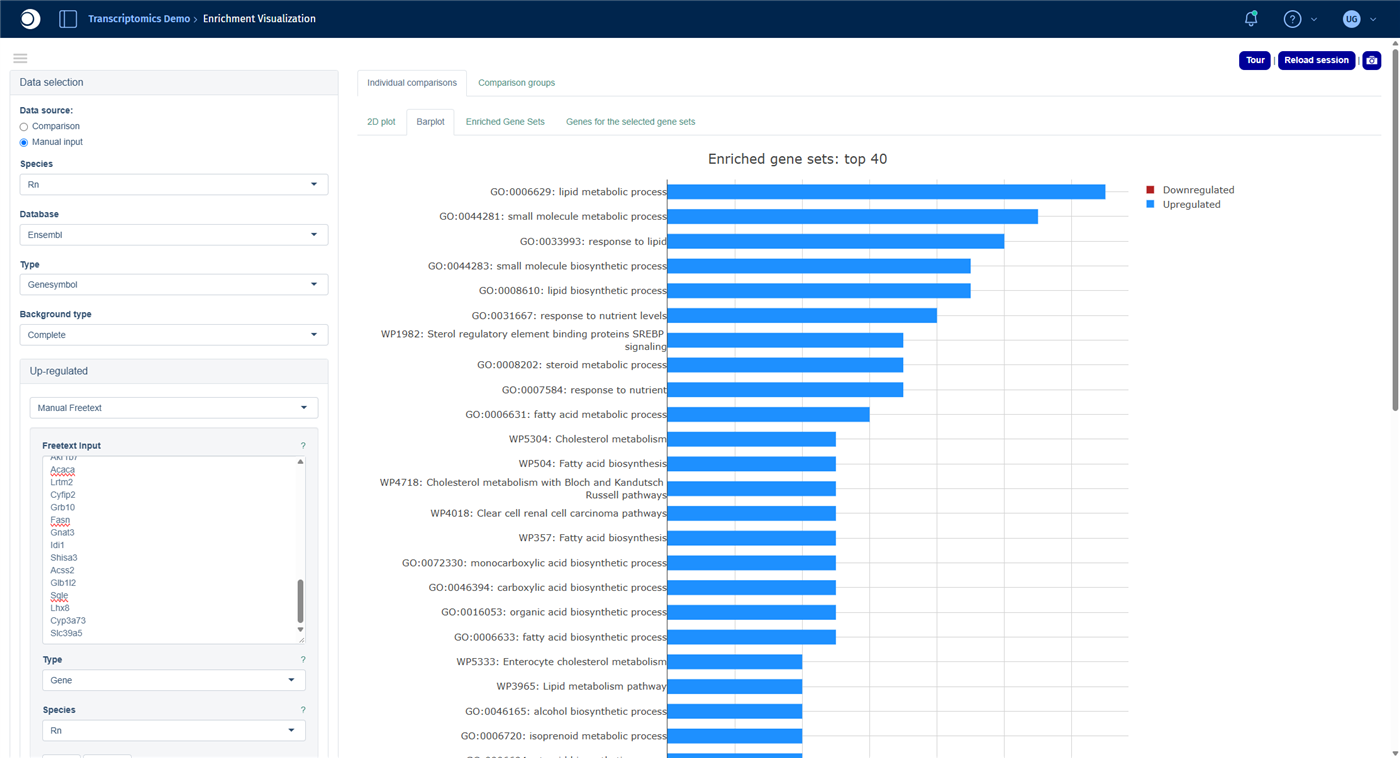
Check your result: enriched gene sets
About 40 gene sets are enriched. The top hits are SREBP signaling, Fatty acid biosynthesis, Cholesterol metabolism with Bloch and Kandutsch-Russell pathways and the GO term lipid metabolic process. The genes that separate young from old and female from male liver samples are dominated by lipid, fatty acid and cholesterol biosynthesis.
Troubleshooting
I cannot see the Exploratory Analysis panel.
The panel is the last one in the left sidebar. Collapse the panels above it, for example Dimension Reduction and Plot Options, by clicking their headers.
Analyze Features does not react.
After closing a message window, the first click on the button is sometimes ignored. Click it a second time.
The Enrichment Visualization finds no or only a few gene sets.
Check that the species is set to your organism in both places (step 6) and that the gene symbols are spelled as in PanHunter. Add the human collections, for example Wikipathways (Hs): they are more comprehensive, and PanHunter maps your genes to their human orthologs.
Next steps
- Turn what you found into a statistically tested comparison, for example liver of old versus young rats, with the guide From differential expression to pathway enrichment.
- Label groups of samples you found in the plot with the Sample Annotations panel and use them in later comparisons.