Starting quality control
General assesement in the Project Overview
In the project overview app, you can check the general parameters for your study, such as the sample size or if the important variables are visible in the details tab.
Investigating Alignment statistics
For further statistics about the data integration we need to go into the ‘Sample QC’ app. First, we are presented with the Alignment statistics tab, showing different histograms for quality parameters.
Number of input reads
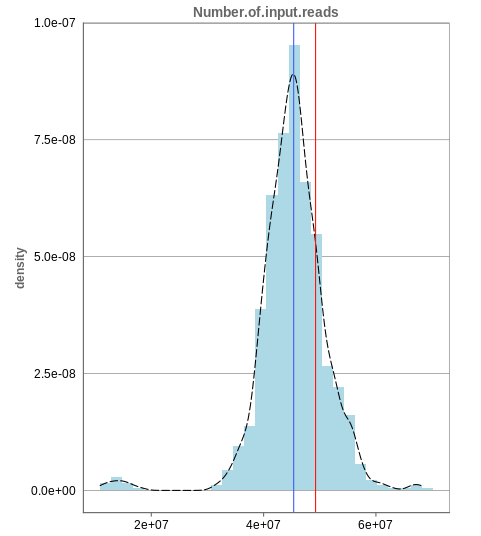
The first histogram is concerned with the number of input reads. While the blue vertical bar shows the median, the red bar shows the position of the current sample selected. A low number of reads can correspond to problematic data, while the definition of “low number” is sometimes subjective and numbers might depend on tissue type or species. Panhunter uses different color codes ranging from white to green to show low to high number of reads in the table below.
While absolute reads may be hard to distinguish by, big jumps should be investigated closely. While most of the data in the picture has 30-60 million reads, there are samples that have half or even less of the input reads. Taking these samples out should yield more homogeneous data which are more meaningful for further analysis.
Unique mapping
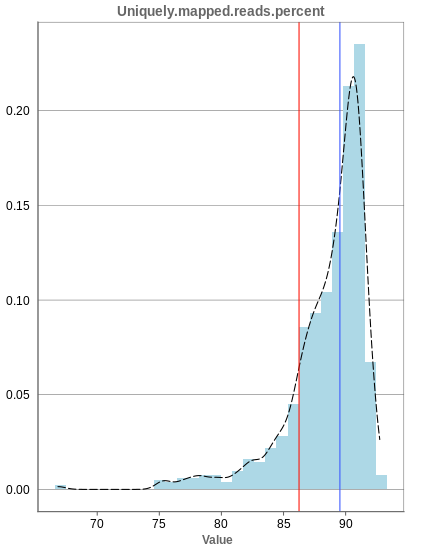
The general plot structure is similar to that of the number of input reads, such that we still want to detect outliers in the histogram. Because non-unique mappings of the input reads are not considered as reads in Panhunter, having a high percentage of uniquely mapped reads is very important.
While the displayed percentage above 85% is good for most samples, there is one with under 70% that should be omitted from the data. This also depends on the type of tissue that was used, such that the given number of 85% is considered meaningful for blood, but when using muscle cells, there might be much more lower numbers.
Mapping to multiple locations
While some reads are uniquely mapped, there is also the case of reads that are not mapped at all and reads that are mapped to multiple locations. As said before, these are not considered in the preprocessing of Panhunter, and only uniquely mapped reads are relevant for the count matrices.
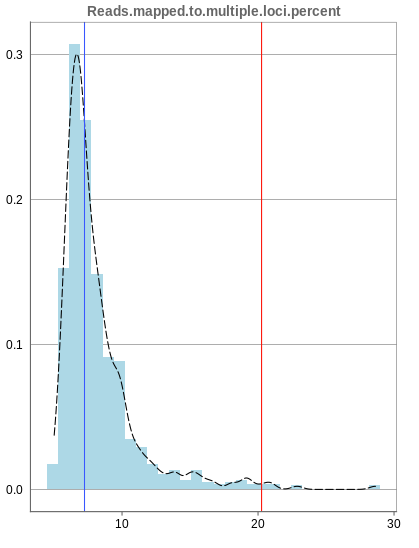
The remaining percentage of reads should largely be composed of multiple mapped reads, i.e. the number of reads that map to no location should be small.