Data upload
1. Creating new study
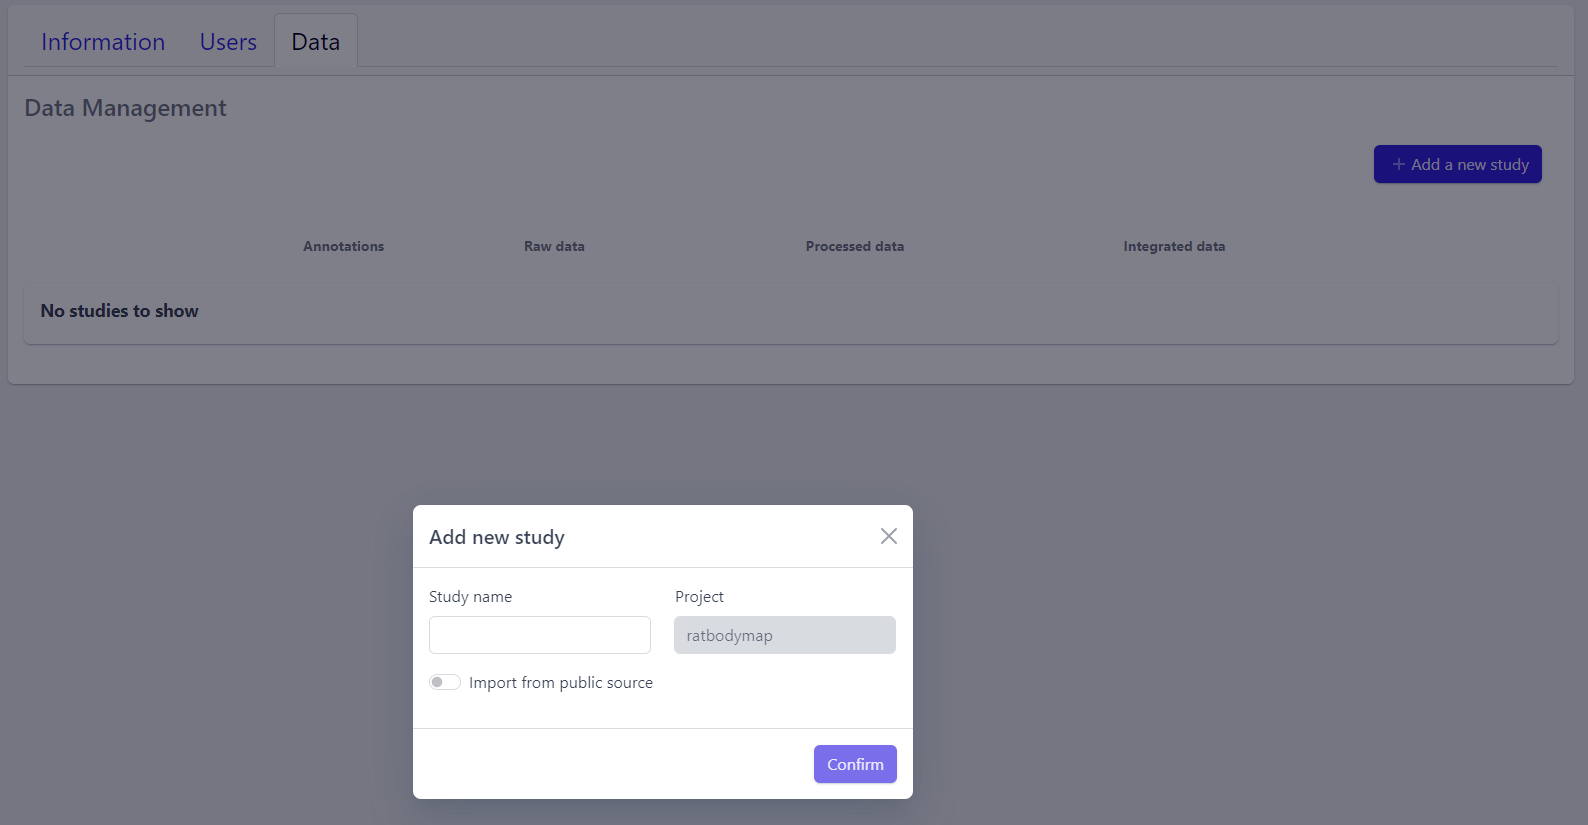
Step 1: New studies can be created in the project by clicking on the Add a new study button in the top right corner of the data overview page.
A pop-up window appears:
Based on the source the data is coming from, the process can be slightly different:
To upload proprietary data or other custom datasets, the process is as follows:
Step 2: Enter a study name in the pop-up window
Step 3: Click on Confirm
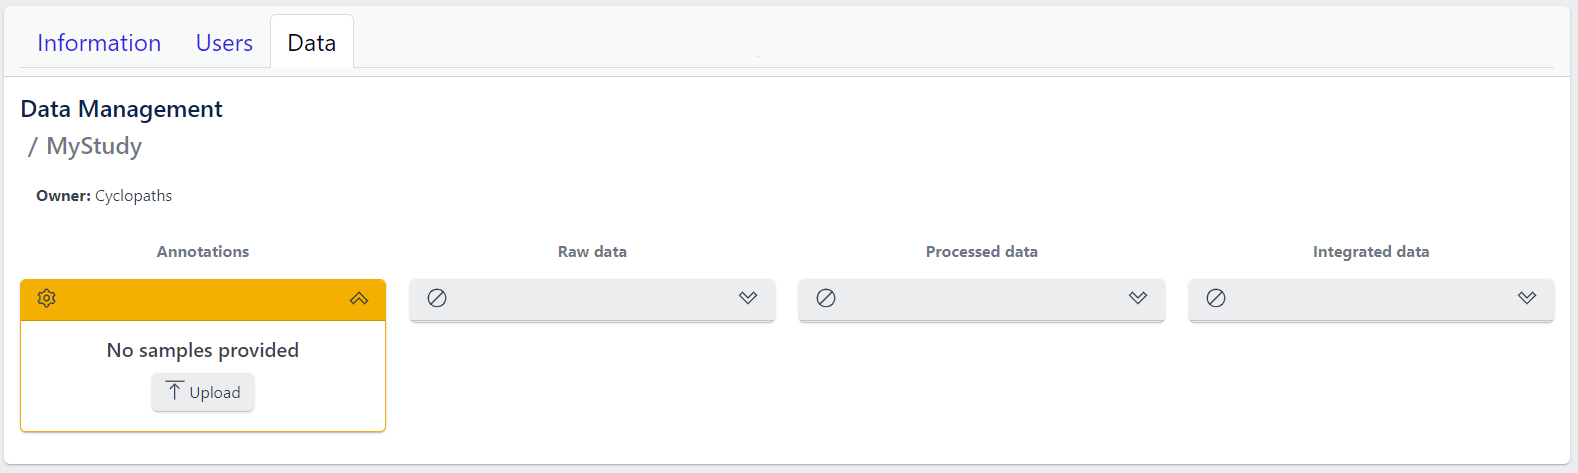
The new study will appear in the studies overview table as a new row, but without any associated samples. The Annotations tile will be coloured yellow with No samples provided status, indicating that the pipeline is ready for sample table upload.
However, with PanHunter it is also possible to import studies directly from public sources.
Direct import from public sources is at the moment supported for Gene Expression Omnibus (GEO), a genomics and transcriptomics database, that freely distributes high-throughput expression data submitted by the scientific community. Datasets are identified by so-called accession numbers (e.g. GSE22423).
Downloading GEO dataset directly from the database can be done with few additional steps:
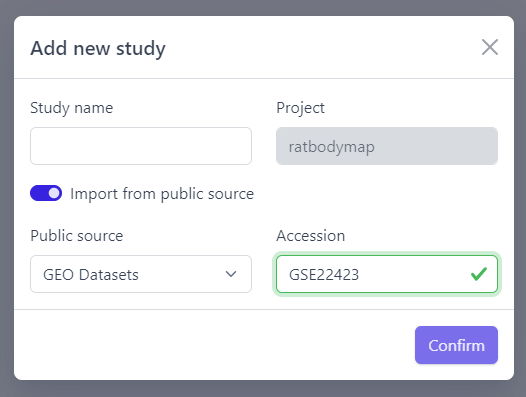
Step 2: Activate Import from public source option
Step 3: Select GEO Datasets as a Public source
Step 4: Enter a valid GEO Accession number
Step 5: Click on Confirm
Panhunter will search for the given dataset accession number in GEO and download sample metadata. If successful, a pop-up window for sample table validation appears and user can proceed with Step 2. of sample table validation.
2. Sample table upload and validation
💡 More details about sample table file can be found under data formats supported.
Once study is successfully created, and Annotations tile is yellow with No samples provided status. This means that we need to upload samples, which is done via sample table upload and validation.
Step 1: To upload samples from a sample table Excel file, click on the Upload button on the Annotations tile and select a file from your computer to import.
📝 In case study is imported from public sources, this step is done automatically.
Step 2: Sample table validation
After the uploaded file is successfully read by PanHunter, a pop-up window to perform sample table validation appears, as displayed below:
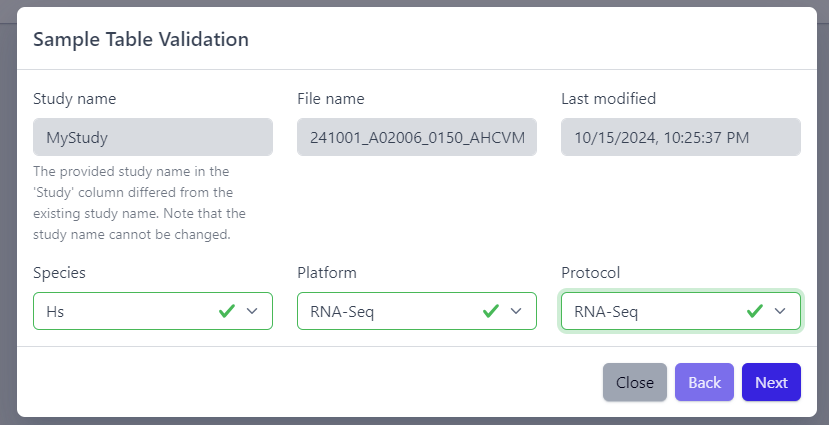
Please note that the Study name, File name and Last modified can not be edited directly. The Study name is defined during the creation of the study, and is taken from the Study column in the sample table file. File name and Last modified are defined by the file itself. To change the study name, please update the sample table file localy and restart the upload.
After you confirmed that Species, Platform and Protocol are correctly preselected, you can start the process of sample table validation by clicking on the Next button.
The result of sample table validation are shown in the same pop-up window:
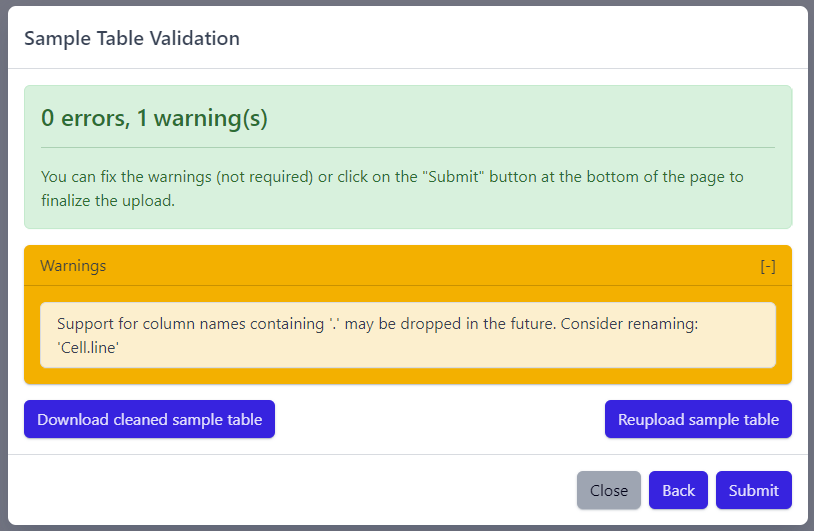
In case of errors (red), the sample table needs to be adapted. If this is the case, it is possible to use the Download cleaned sample table button to get the sample table file and modify it locally. Once sample table is modified as needed, click on the Reupload sample table button to upload the new version. The validation will be run again.
Please note that fixing warnings (yellow) is not required, but is recommended.
Step 3: Finish sample import
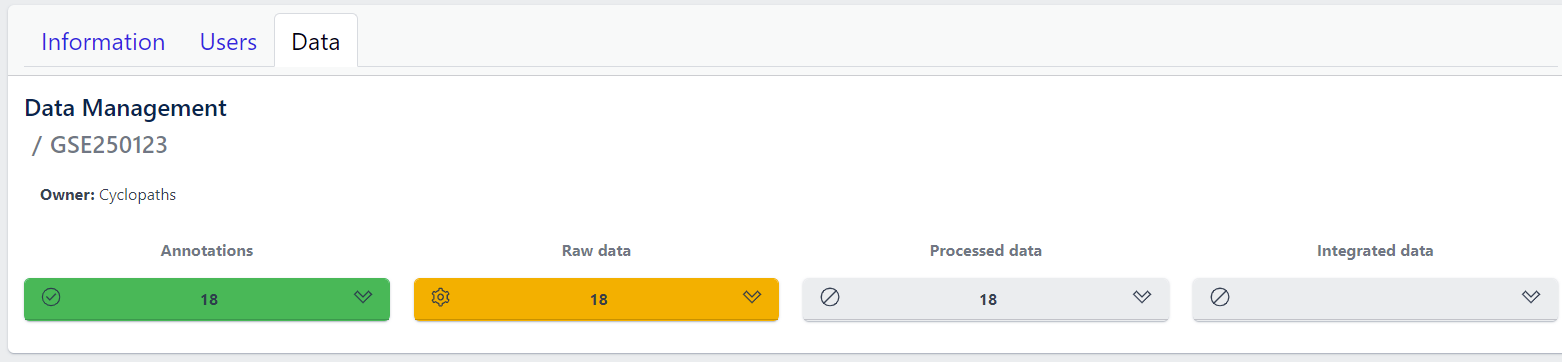
Once the validation passed without errors, click on the Submit button and samples will be imported and added to the study. Successfull upload of samples and study metadata will be indicated in the study details view as a green Annotations tile and the yellow Raw data tile, which indicates that the pipeline is ready for import of raw data.
3. Raw data import
After studies are successfully created and samples are uploaded, the yellow coloured Raw data tile indicates that the pipeline is ready for upload of raw data.
📝 Info: Import of raw data via the user interface is currently supported for GEO (link) and proteomics datasets. In case you have other types of data, please contact PanHunter Support.
Step 1: Expand yellow Raw data tab in the detailed study view
Step 2: Click on the Import button
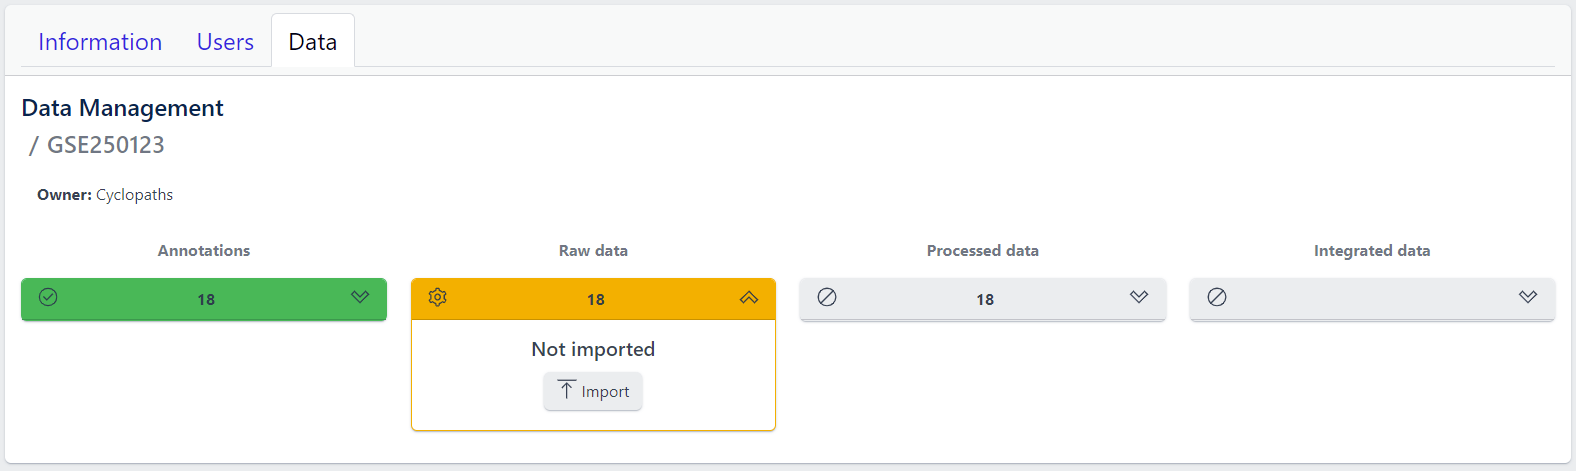
After starting the import, raw data files will be downloaded directly from GEO, with no additional input from user required.
To import output files of mass spectometry instruments, please fill in all required information in the pop up window and select files from local storage to be uploaded.
💡 This section is currently in progress - for more information please contact PanHunter Support.
Once import of raw data is initiated, a background job is started on the server. Blue coloured Raw data indicates that the process is running.
Once the import of raw data is sucessfully completed, Raw data stage is coloured green and displays the number of samples for which raw data is available. Additionally, Processed data tile is coloured yellow, indicating that the data is ready for processing.
In case an error occurs, it is indicated by the red Raw data tile that can be expanded via click to investigate the job output.
4. Data processing
Once raw data is available for imported samples, you can proceed with data processing. The data is ready for processing once Annotations and Raw data stages are successfully finished, and thus coloured green, and Processed data is coloured yellow with Not processed status.
Step 1: Unfold Processed data tile in the detailed study view.
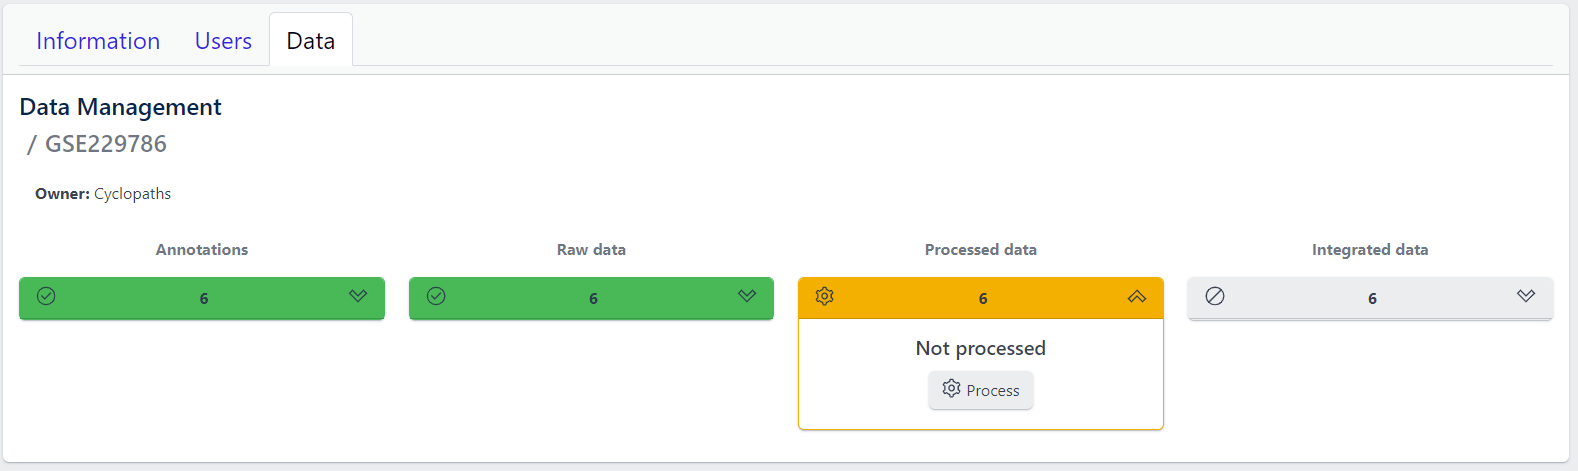
Step 2: Click on the Process button
Once the processing is initiated, a background job is started on the server. Blue coloured Processed data indicates that the job is running. Please keep in mind that depending on dataset sizes, these jobs may run for multiple hours or even days.
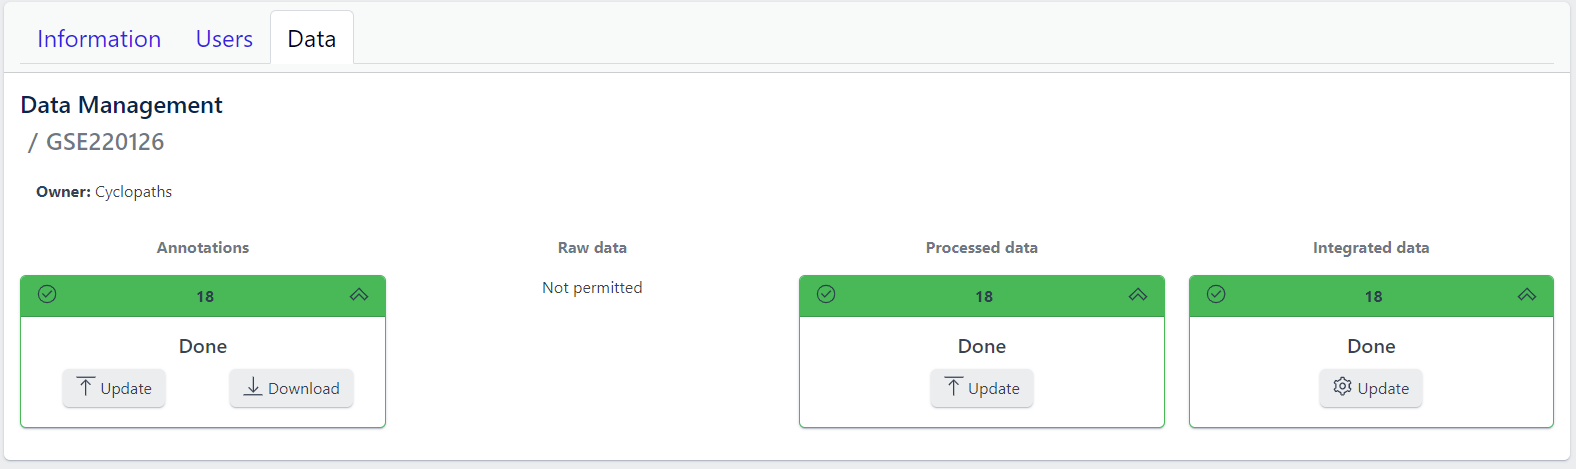
Once sucessfully completed, the Processed data stage turns green, displaying Processed status. Additionally, Integrated data tile is now coloured yellow, indicating that the data is ready for integration.
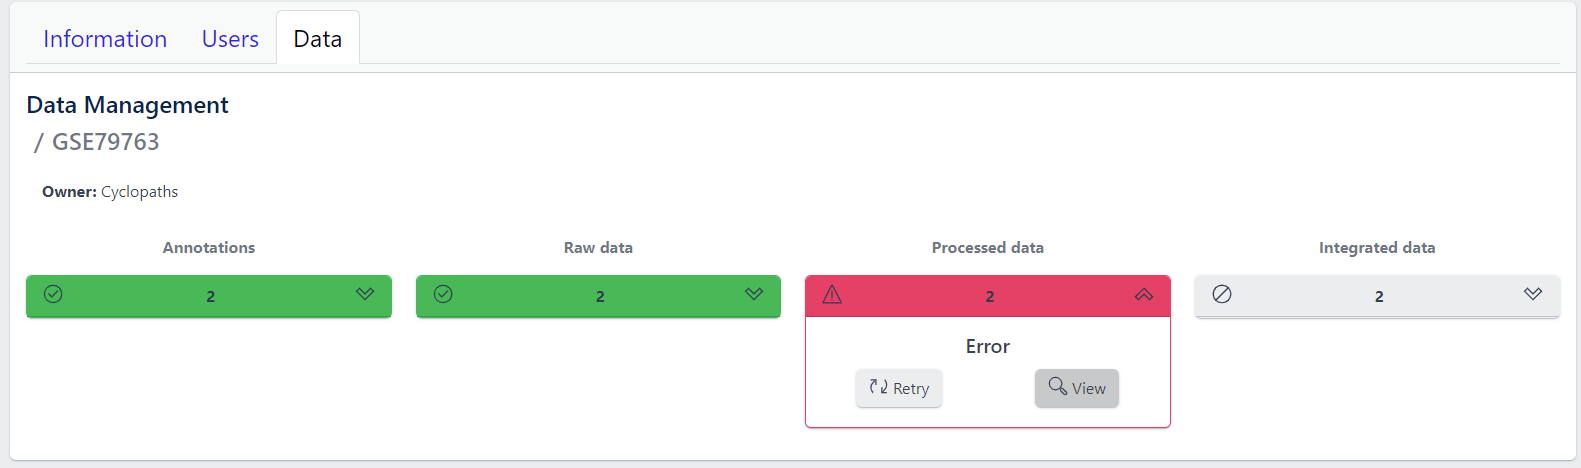
In case of a failure, Processed data stage turns red displaying Error status. To investigate what went wrong, please click on the View button to see output of the job. Clicking on the Retry button will start data processing again.
5. Integration of processed data
Once processed data is available in the study, the data is ready to be integrated to PanHunter. The pipeline is ready for integration once Processed data is coloured green and Integrated data is coloured yellow. Data will be available in PanHunter only after integration process is successfully finished.
Similar to the previous stages described above, the Integrated data tile in the study details view allows to run data integration jobs.
Step 1: Unfold Integrated data tile in the detailed study view.
Step 2: Click on the Integrate button
Clicking on the Integrate button starts a background job on the server. While the process is running, the Integrated data tile will be coloured blue.
Once sucessfully completed, the Integrated data stage turns green and data automatically becomes available in PanHunter apps.
In case of a failure, the Integrated data turns red displaying Error status. To investigate what went wrong, please click on the “View” button to see output of the job. Clicking on the Retry button will start data processing again.